
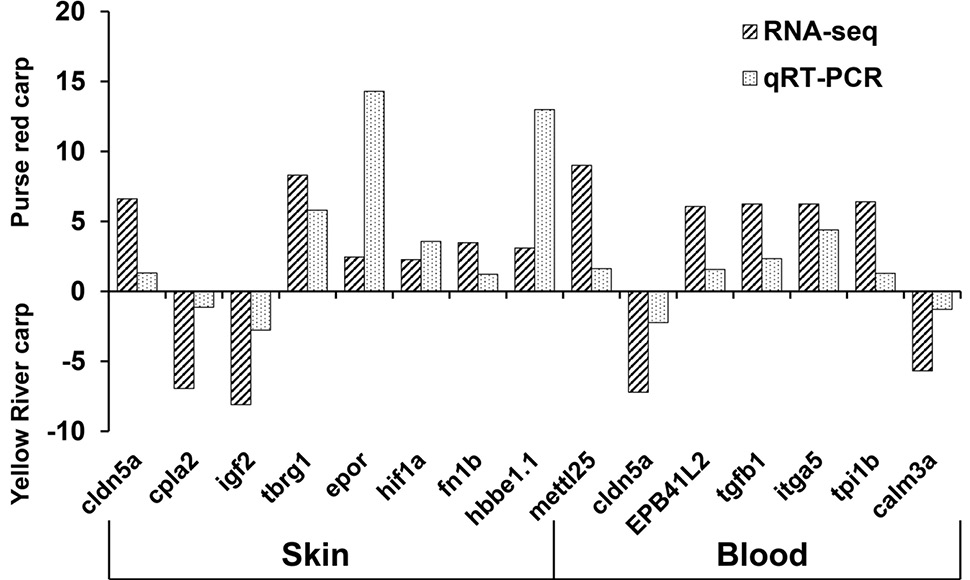
Fig. 2.
Comparison of gene expression patterns obtained using comparative transcriptome analysis and qRT-PCR. Fold changes are expressed as the ratio of gene expression comparing purse red carp with Yellow River carp after normalization to β-actin.