View larger version:
Download Original File
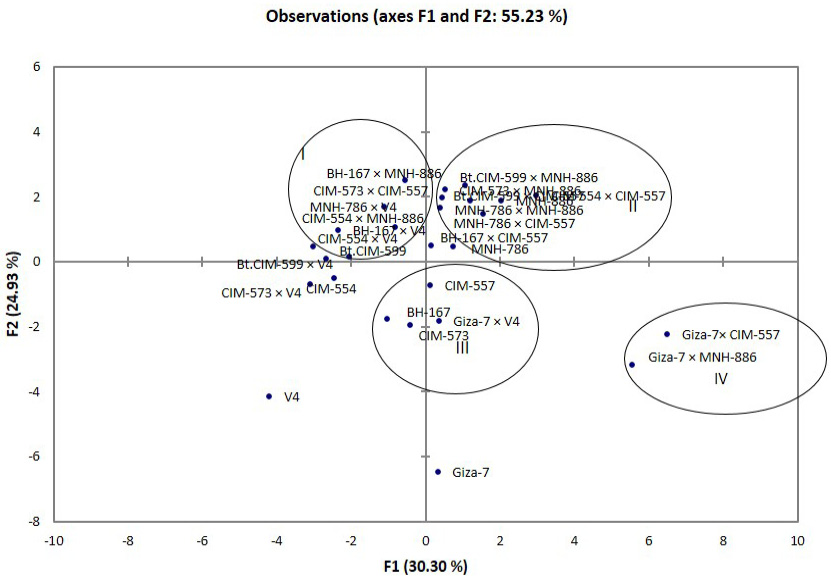
Figure 1
PC scatter plot showing genotypes on first two PCs.
