
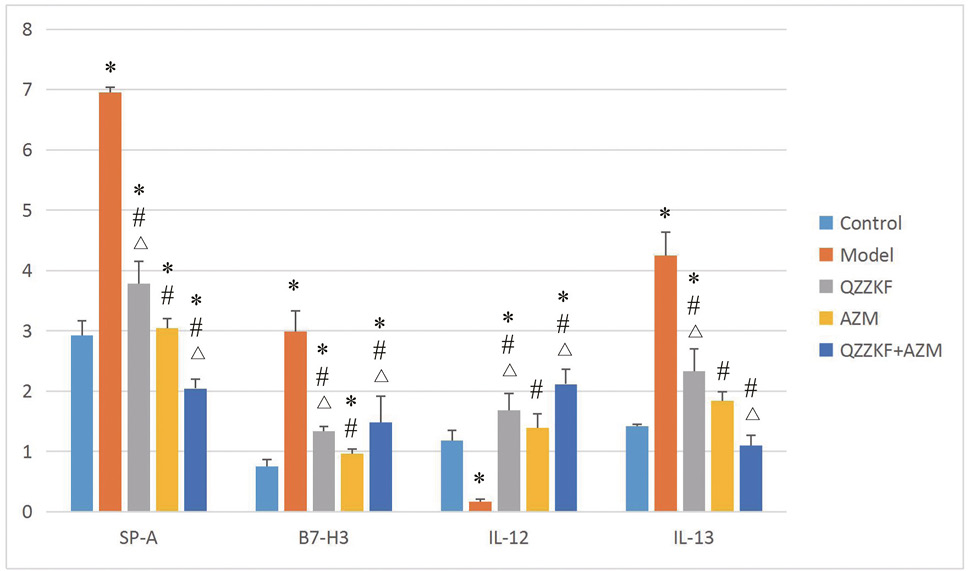
Fig. 3.
Gene expression levels of SP-A, B7-H3, IL-12, and IL-13 in the lung tissues of mice. Data are presented as the mean ± SD (n = 8–10). *p < 0.05 compared to the control group; #p < 0.05 compared to the model group; and △p<0.05 compared to the AZM group.