
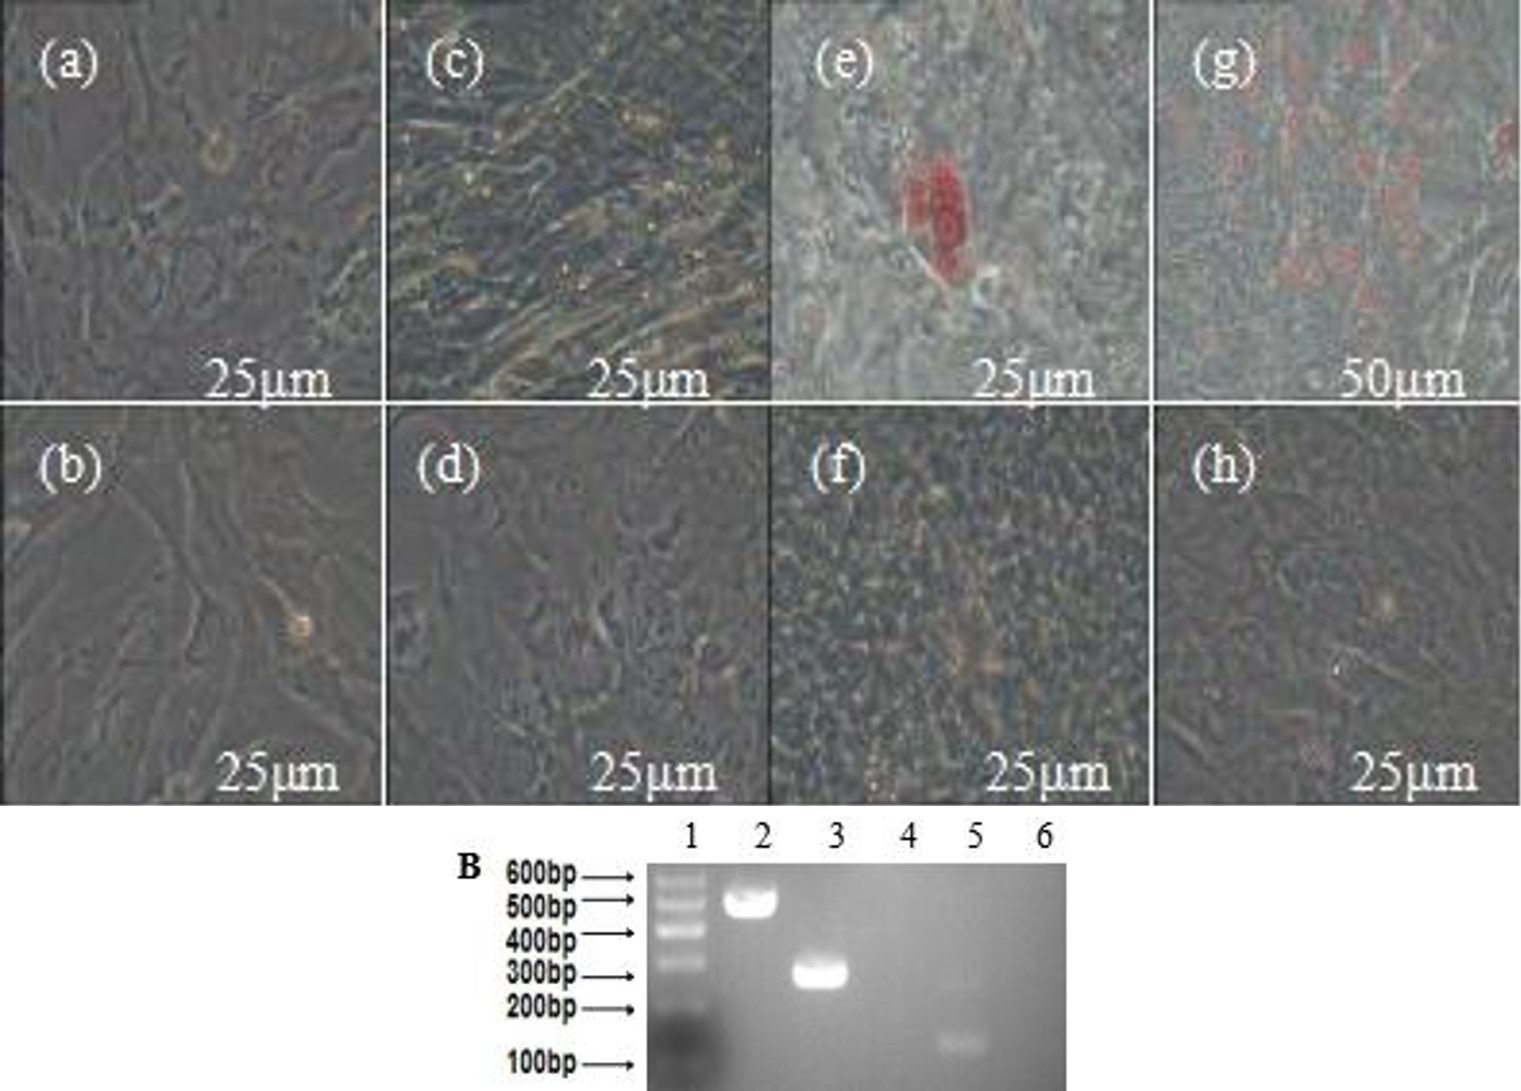
Fig. 7.
Adipogenic differentiation of MDSCs. A (a and b), the cell wasn’t induced of the induced group and the control group; d, f and h, the control group of adipogenic differentiation, after 1 d, 7 d and 14 d, and were also negative for oil red O staining; c, MDSCs induced in the inducing culture medium after 7 d, and many intracellular lipid droplets were present in the induced cells; e and g, After 14 d, the cells of induced group were positive for oil red O staining (bar=25μm). B, RT-PCR detection of the adipogenic markers LPL and PPAR-γ expression. 1, marker; 2, GAPDH; 3, LPL+; 4, LPL- (MDSCs); 5, PPAR-γ+; 6, PPAR-γ- (MDSCs).