
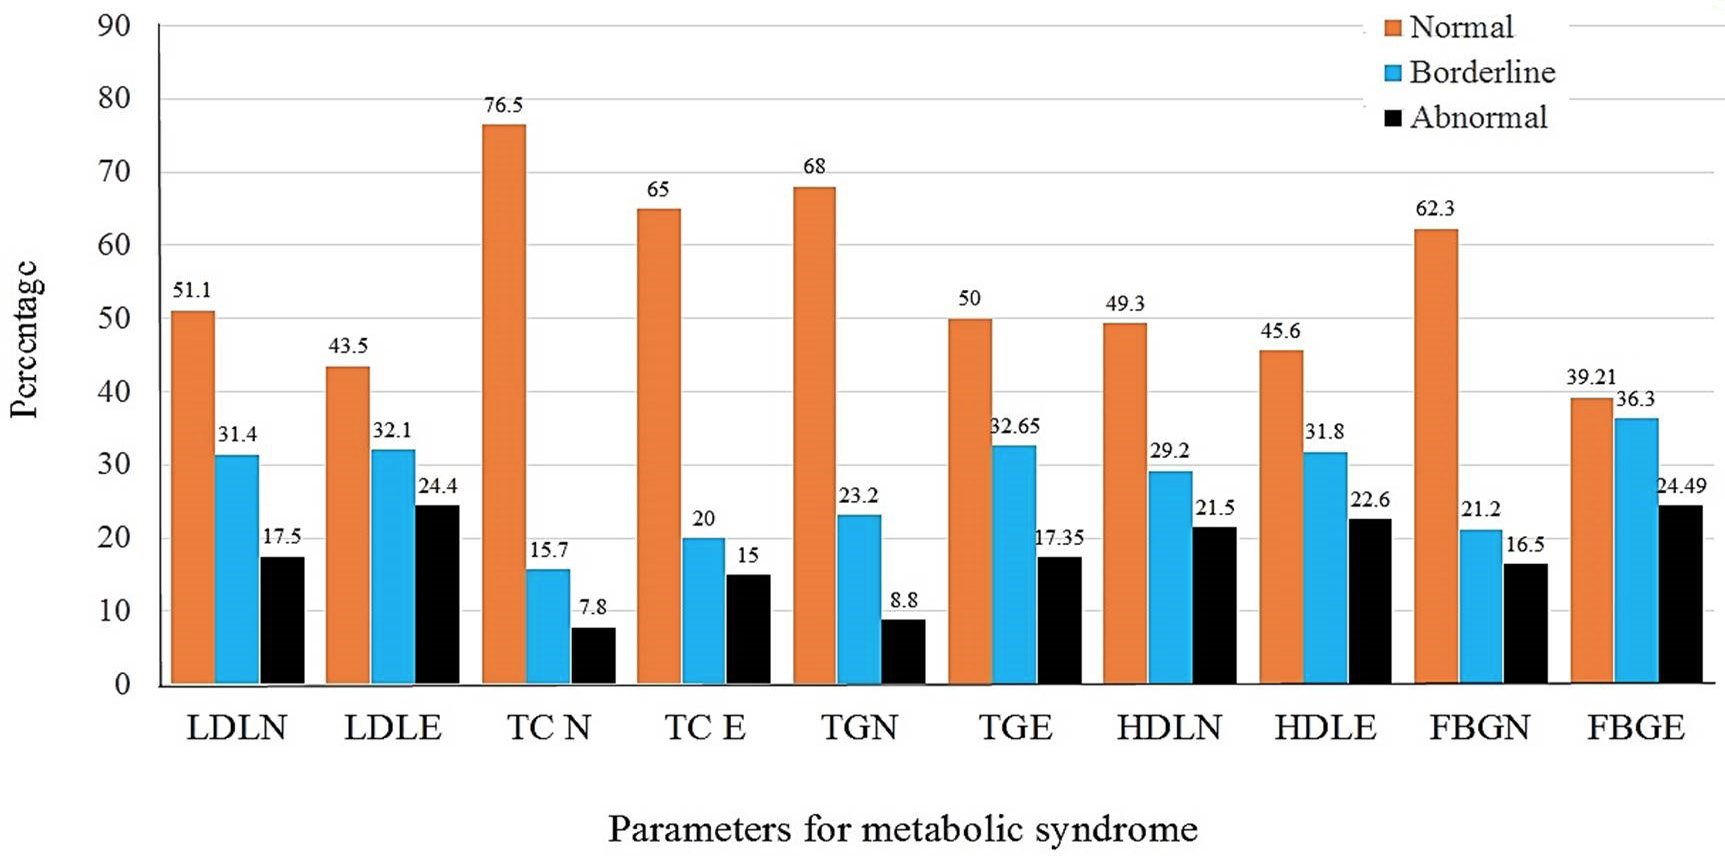
Fig. 5.
The percentage of general population (N) and bank employees (E) with normal, border level and abnormal glucose level, BMI and lipid profiles.
The percentage of general population (N) and bank employees (E) with normal, border level and abnormal glucose level, BMI and lipid profiles.