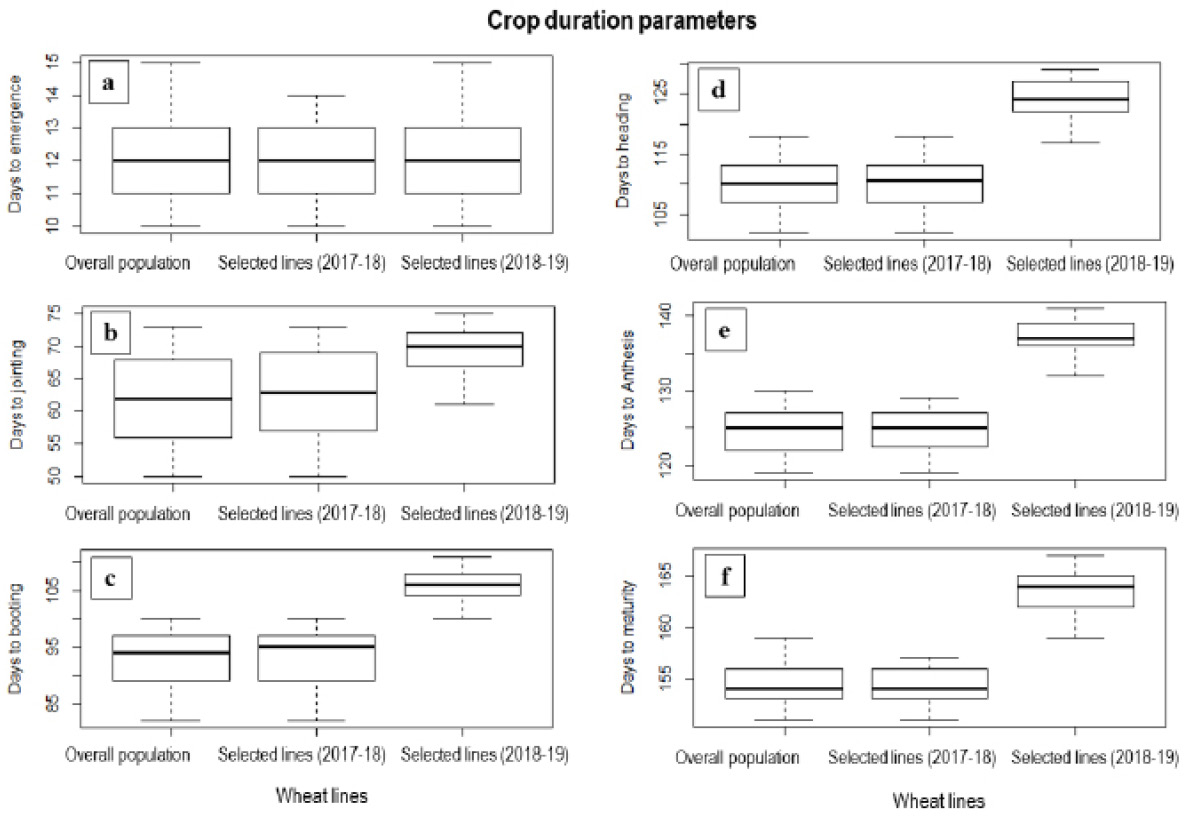
Figure 3:
Distribution of crop duration parameters for various set of Chinese wheat hybrids as subjected to selection. The upper line represents the maximum, the lower line represents the minimum, which the middle bold line represents the average values. The dots represent the outlier values, if any.