
Figure 2
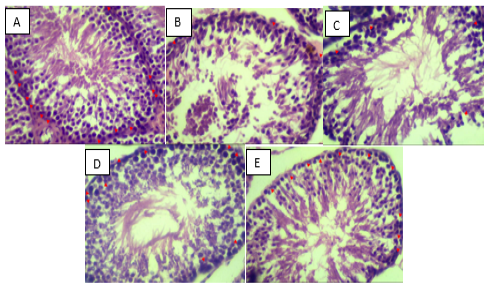
Sertoli cells on mice negative control (A), positive control (B), P1 (C), P2(D), and P3(E) with red arrow ( ) (400x)
Sertoli cells on mice negative control (A), positive control (B), P1 (C), P2(D), and P3(E) with red arrow ( ) (400x)