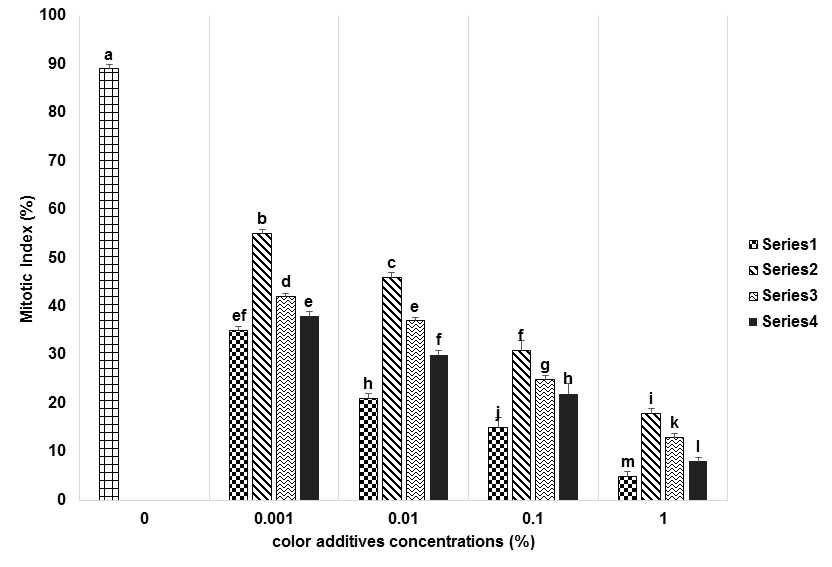
Figure 2:
Mitotic index of onion (Allium cepa) root tips treated with 0%, 0.001%, 0.01%, 0.1% and 1% concentration of four used food colour additives. The first bar at 0% concentration showed control of the study while series-1 indicated the allura red, series-2 indicated the sunset yellow, series-3 indicated the tartrazine, and series-4 indicated fast green FCA bars. Similar letters are representing no difference among treatments of each FCA (n = 4).