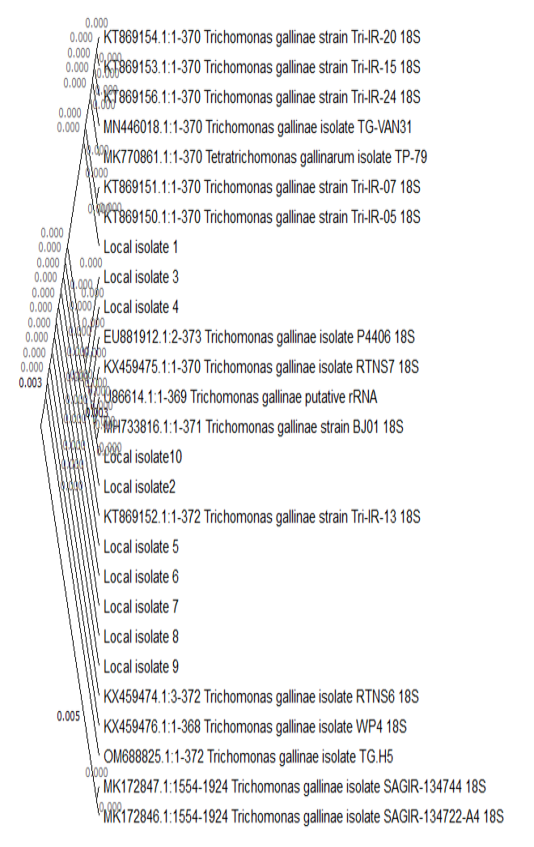
The Tamura-Nei model and the Maximum Likelihood approach were used to infer the evolutionary history. The tree that has the highest log probability is displayed (-528.91). By automatically applying the Neighbor-Join and BioNJ algorithms to a matrix of pairwise distances calculated using the Tamura-Nei model, and then choosing the topology with the highest log likelihood value, the initial tree(s) for the heuristic search were created. The rate variation model permitted some sites ([+I], 0.00% sites) to be evolutionarily invariable. There were 27 nucleotide sequences in this analysis. Codon positions 1st+2nd+3rd+Noncoding were included. The final dataset contained 374 locations altogether. In MEGA11, evolutionary analyses were carried out (Tamura et al., 2021).