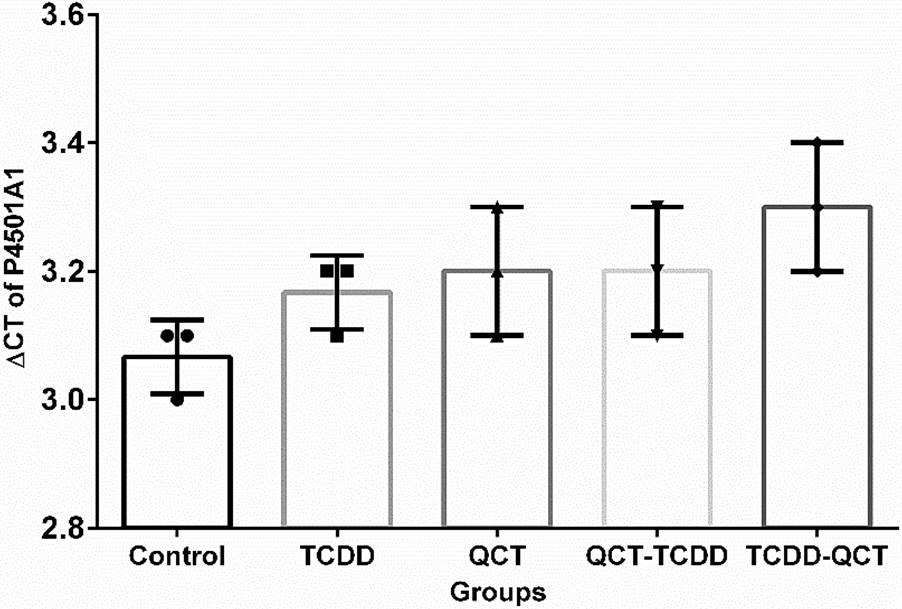
The mRNA expression level of each normal controls and treatment groups according to ΔCT of P4501A1 gene.
