Figure 3
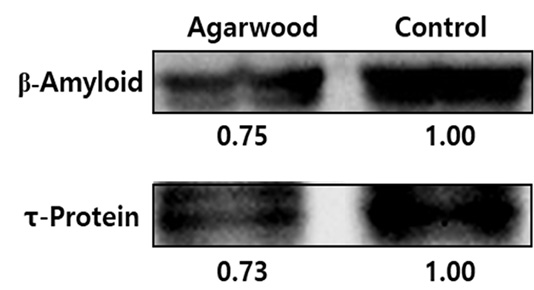
Western blot analysis of β-Amyloid and τ-protein for control and AE groups. The degrees of Aβ (0.75) and τ-protein (0.73) expression were denoted as the proportion to the control group (1.00).
Western blot analysis of β-Amyloid and τ-protein for control and AE groups. The degrees of Aβ (0.75) and τ-protein (0.73) expression were denoted as the proportion to the control group (1.00).