
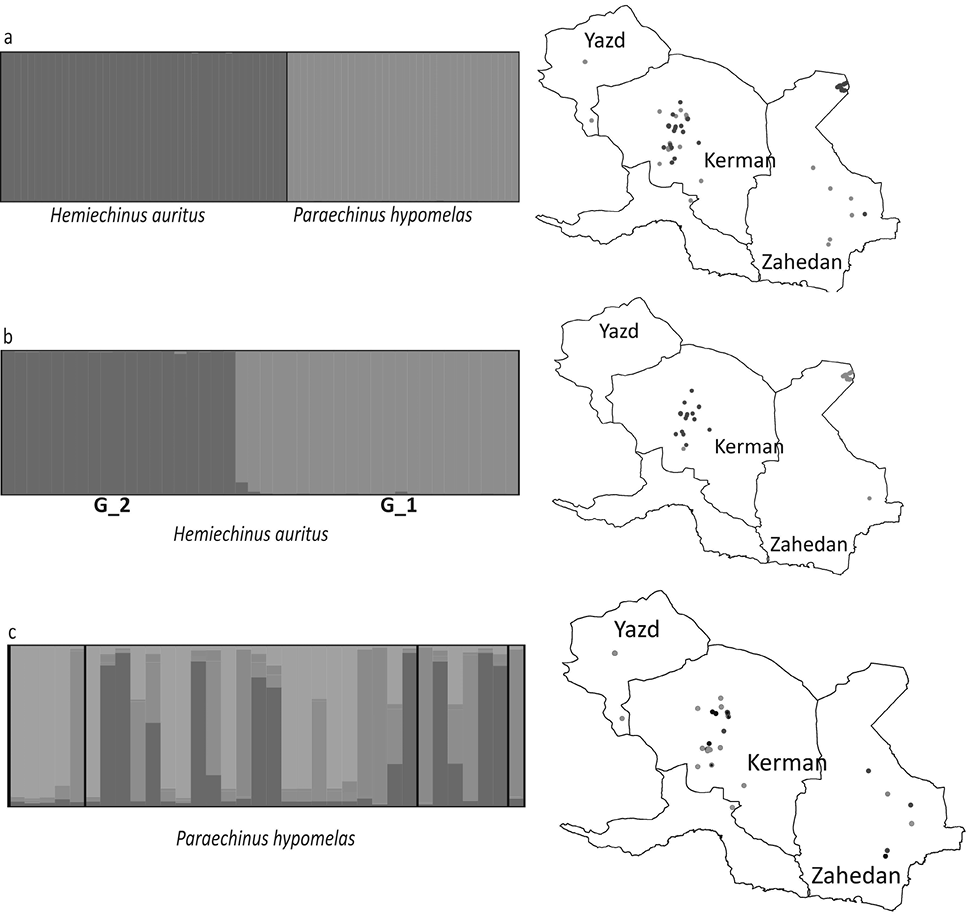
Fig. 2.
Evaluation of genetic structure of two species of H. auritus (b) and H. hypomelas (c) based on Bayesian model and cytochrome b sequencing in STRUCTURE. The black spots in figure c represent admix individuals (Qi <0.8).
Evaluation of genetic structure of two species of H. auritus (b) and H. hypomelas (c) based on Bayesian model and cytochrome b sequencing in STRUCTURE. The black spots in figure c represent admix individuals (Qi <0.8).