
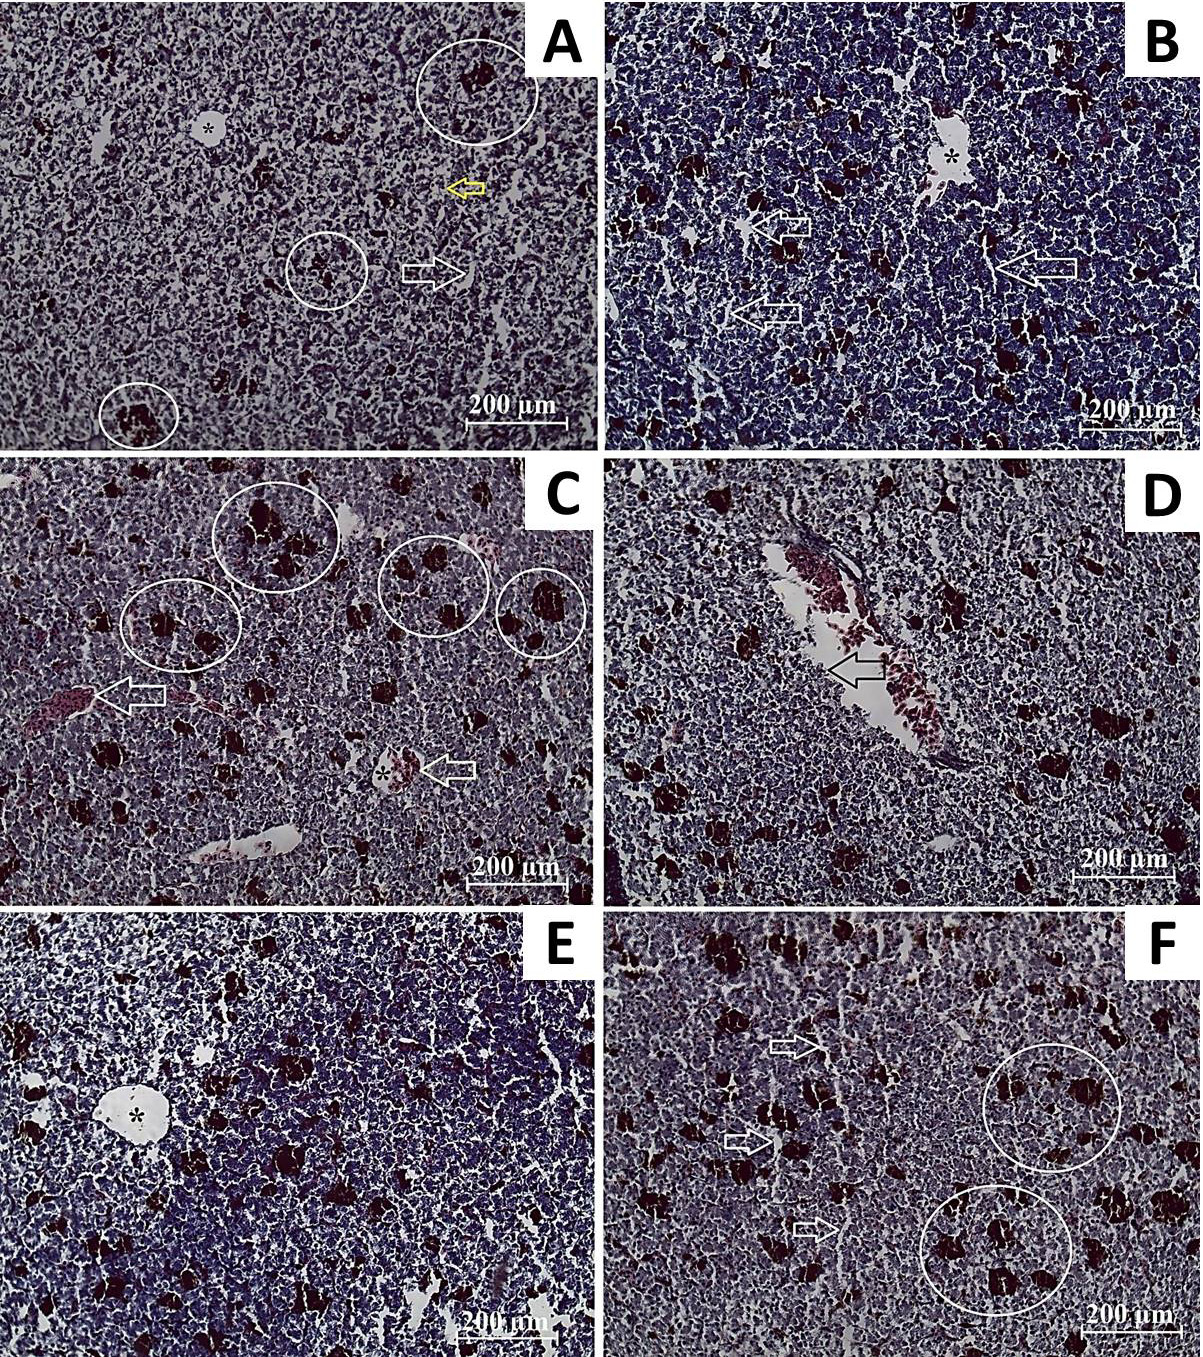
Fig. 3.
Histological structures and alterations of the liver of P. ridibundus. A; samples of DB1, B, C; samples of DB2: A, sinusoids (white arrow), central vein (asterisk), hepatocytes (yellow arrow) and melanomacrophage aggregation (encircled). B, degeneration of central vein (asterisk) and sinusoidal dilatation (arrows). C, increasing melanomacrophage aggregation (encircled), congestions of the central (asterisk) and portal vein (arrows). D, E, F samples of SV. D, degeneration of vascular epithelium (arrow). E, non-homogenous parenchyma. F, sinusoidal dilatations (arrows) and increasing melanomacrophage aggregation (encircled), (H&E).