
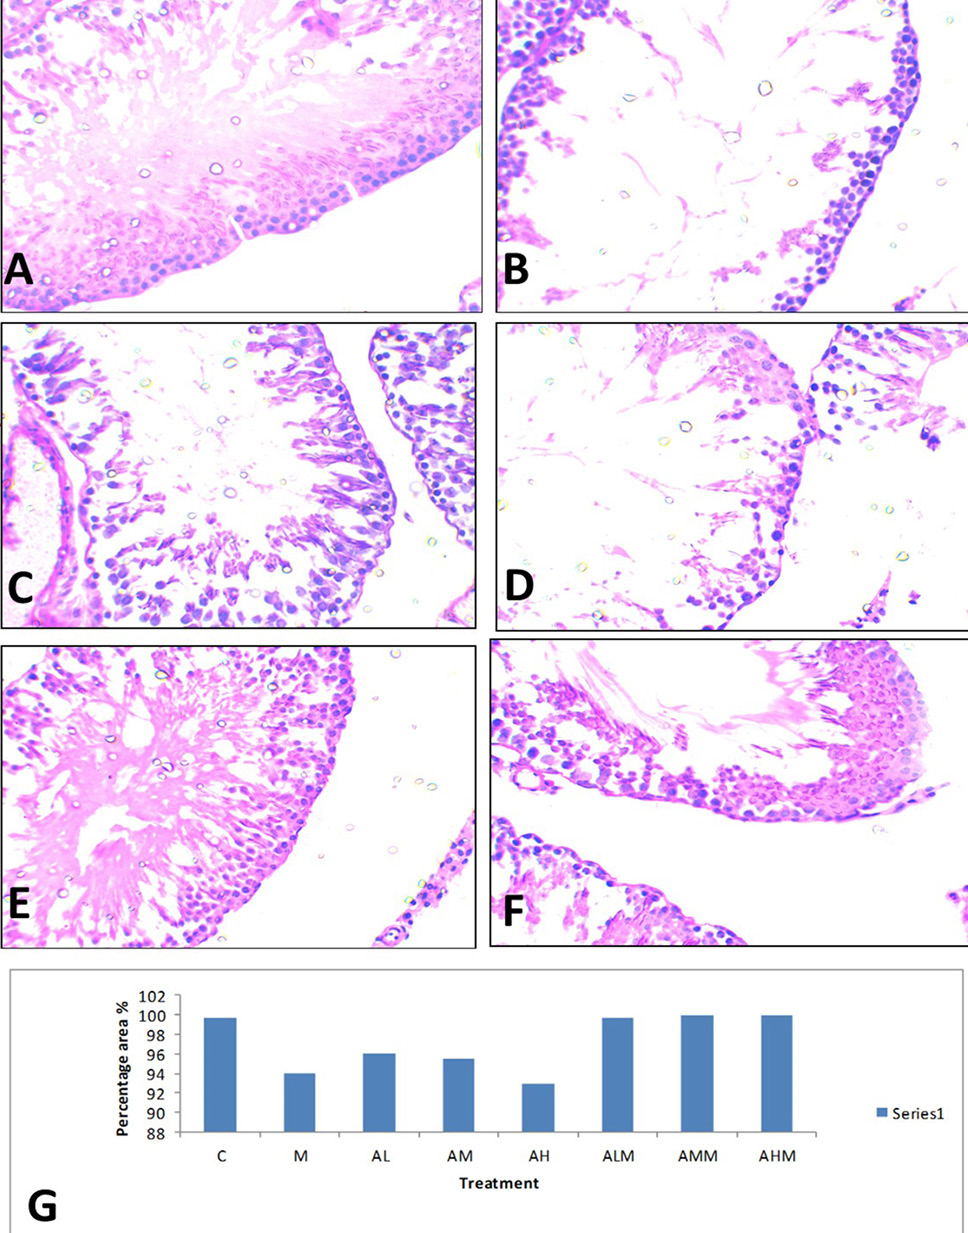
Fig. 2.
Cross sections from testis, (A) control group with positive PAS increase in the basement membrane of the tubules (the tunica albuginea) as well as in the intertubular connective tissue of the testes. (B, C, D and E) Testis of mint, AL, AM and AH treated group showing decrease PAS reaction. (F, G and H) Testis of ALM, AMM and AHM group showing normal positive PAS. (PAS staining technique, 400X). (I) Percentage of PAS stained area in the treated group.