
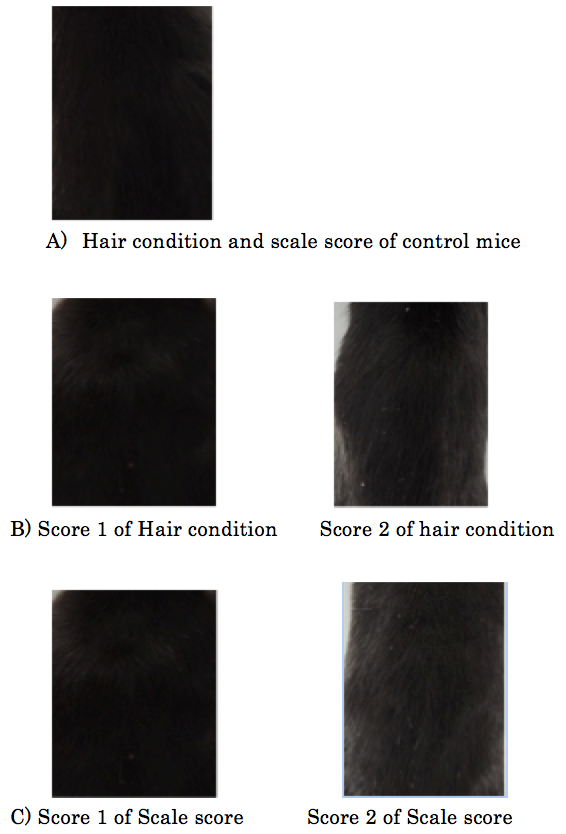
Fig. 1.
Representative photos of hair condition and scale score in mice. A, indicates the normal hair condition and scale score of control mice; B, represents each score of hair condition; C, each score of scale score.
Representative photos of hair condition and scale score in mice. A, indicates the normal hair condition and scale score of control mice; B, represents each score of hair condition; C, each score of scale score.