
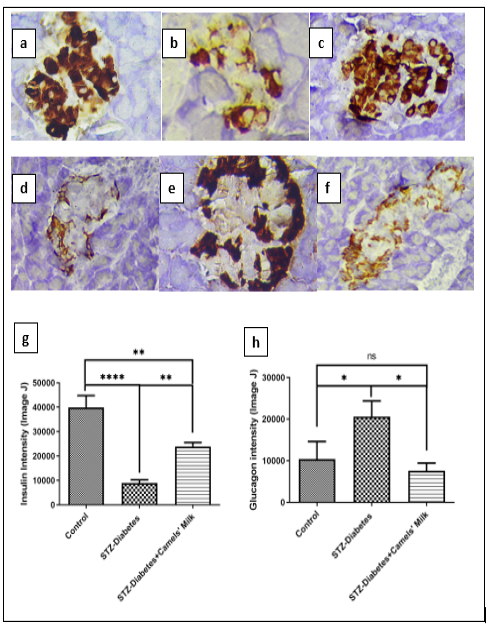
Figure 8
IHC of pancreatic tissues showed that the intensity of insulin and glucagon staining in Control: Chow and water (ad libitum), STZ-Diabetes: injected with single dose of STZ 40mg/kg) on day0, STZ-Diabetes+Camels’ Milk: STZ )40mg/kg) on day0 followed by administration of camels’ milk. . a. Control-insulin, b. STZ-Diabetes-insulin, c. STZ-Diabetes+Camels’ Milk-insulin, d. Control-glucagon, e. STZ-Diabetes-glucagon, f. STZ-Diabetes+Camels’ Milk-glucagon, g and h: Histograms showing means and SEM of insulin and glucagon, respectively. One way ANOVA and Newman-Keuls Multiple Comparison Test, N=10 *P<0.05 and **P<0.01. (20X magnification)