
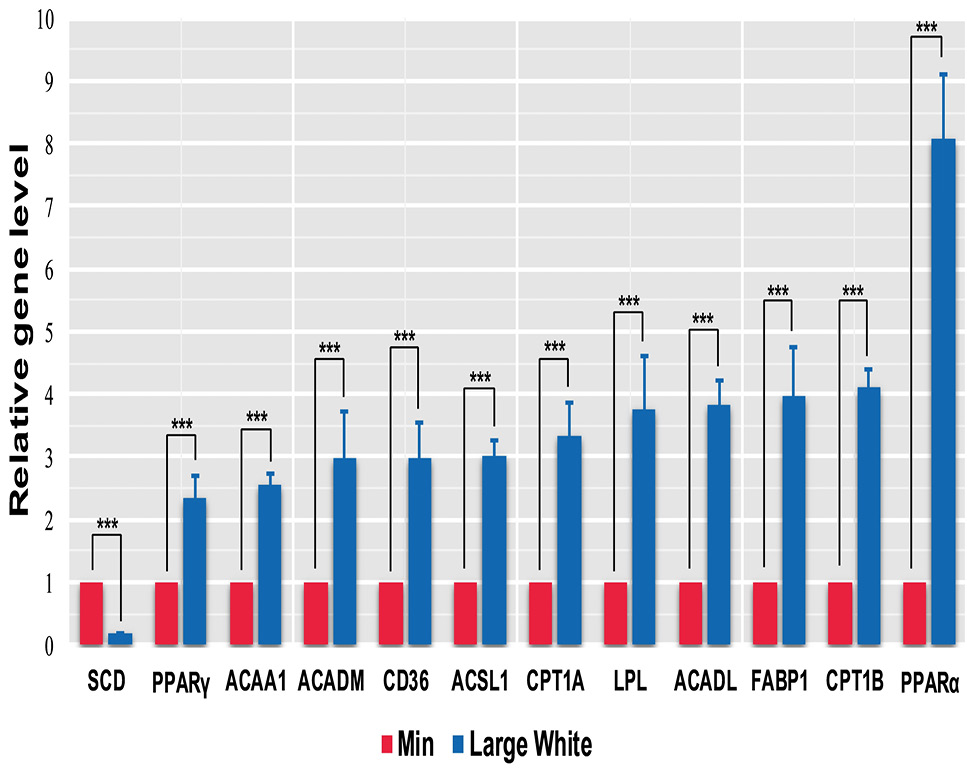
Fig. 4.
Comparisons of the expression levels of twelve key hub genes (PPARA, CD36, FABP1, LPL, ACSL1, CPT1A, CPT1B, ACAA1, ACADL, ACADM, PPARG and SCD) in the PPAR signaling pathway in the two pig breeds. A p value less than 0.05 and |logFold Change(FC)| ≥1 were regarded as the cutoff thresholds for DEGs. All data are shown as means ± SEM (n=3), ***P<0.001.