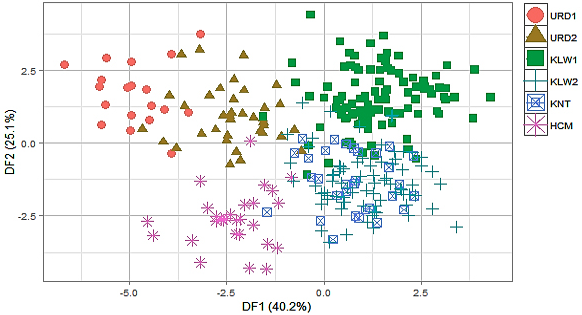
Fig. 5.
Discrimination plot of Cyclocheilichthys apogon individuals along DF1-DF2 axes of discriminant function analysis (DFA) on truss-network variables showing three separated groupings of the samples according to their river drainages.
