
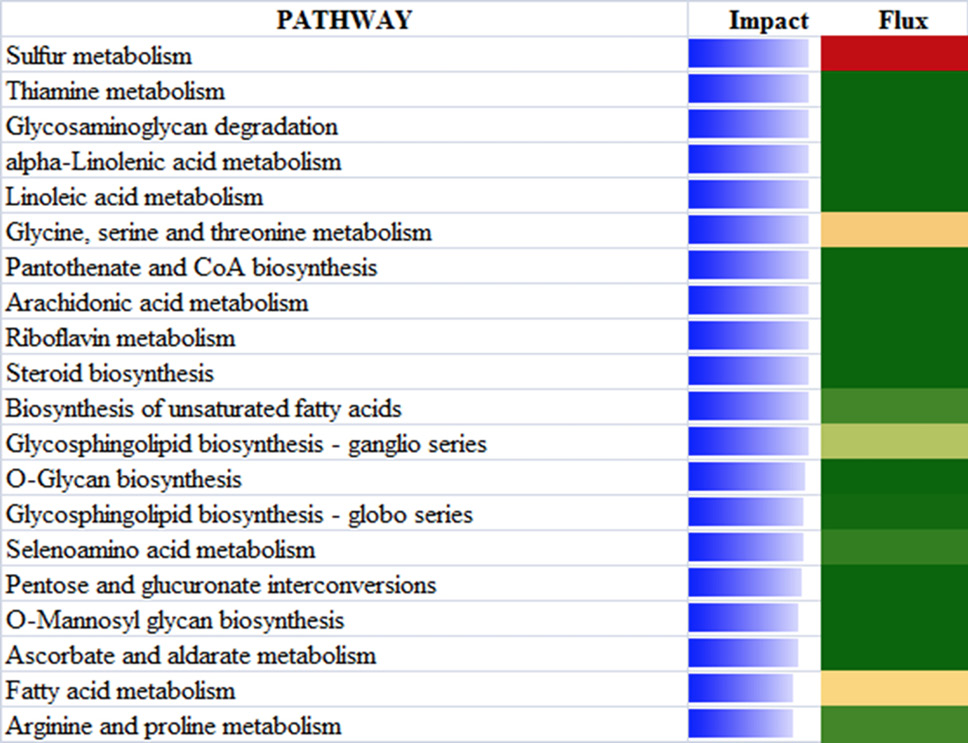
Fig. 2.
The top 20 most affected metabolic Kyoto Encyclopedia of Genes and Genomes pathways ranked by overall effect value in adipose tissues of beef cattle on comparison of 18 vs 24. The transparent bars represent the effect values (0 to 50), flux represents the direction of each category and the corresponding subcategory (green color, inhibition; yellow color, stable; red color, activation, with different color intensities according to the level of upregulation or downregulation).