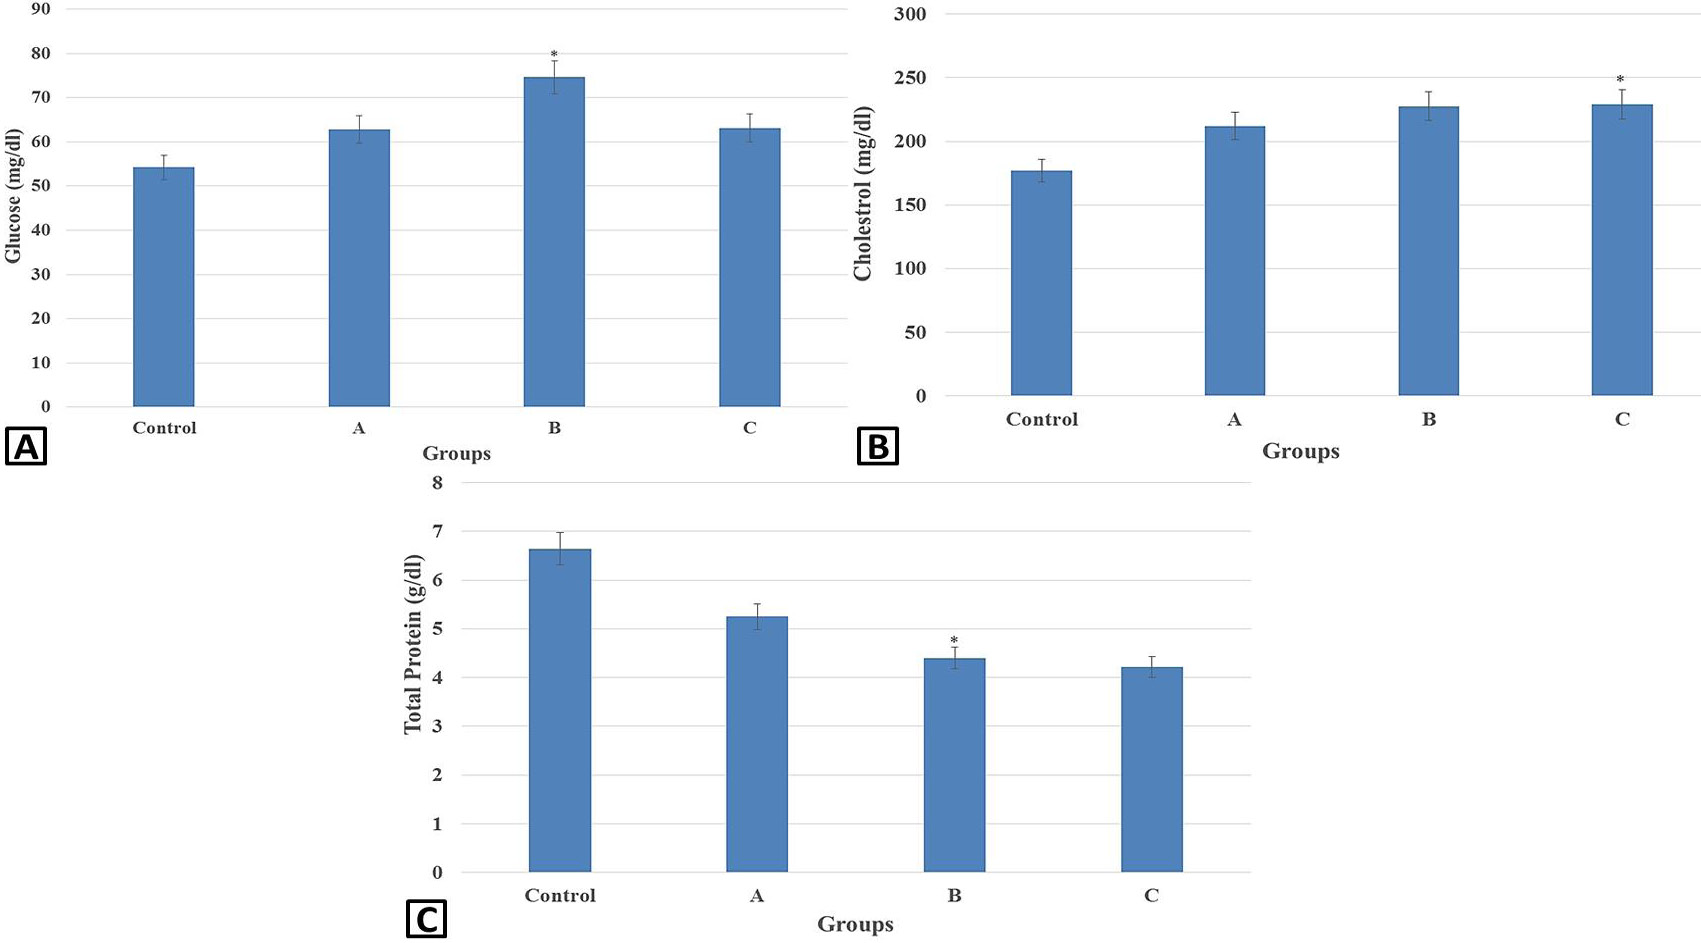
Glucose (A), cholesterol (B) and total protein (C) concentrations in control and experimental groups.
