
Fig 5
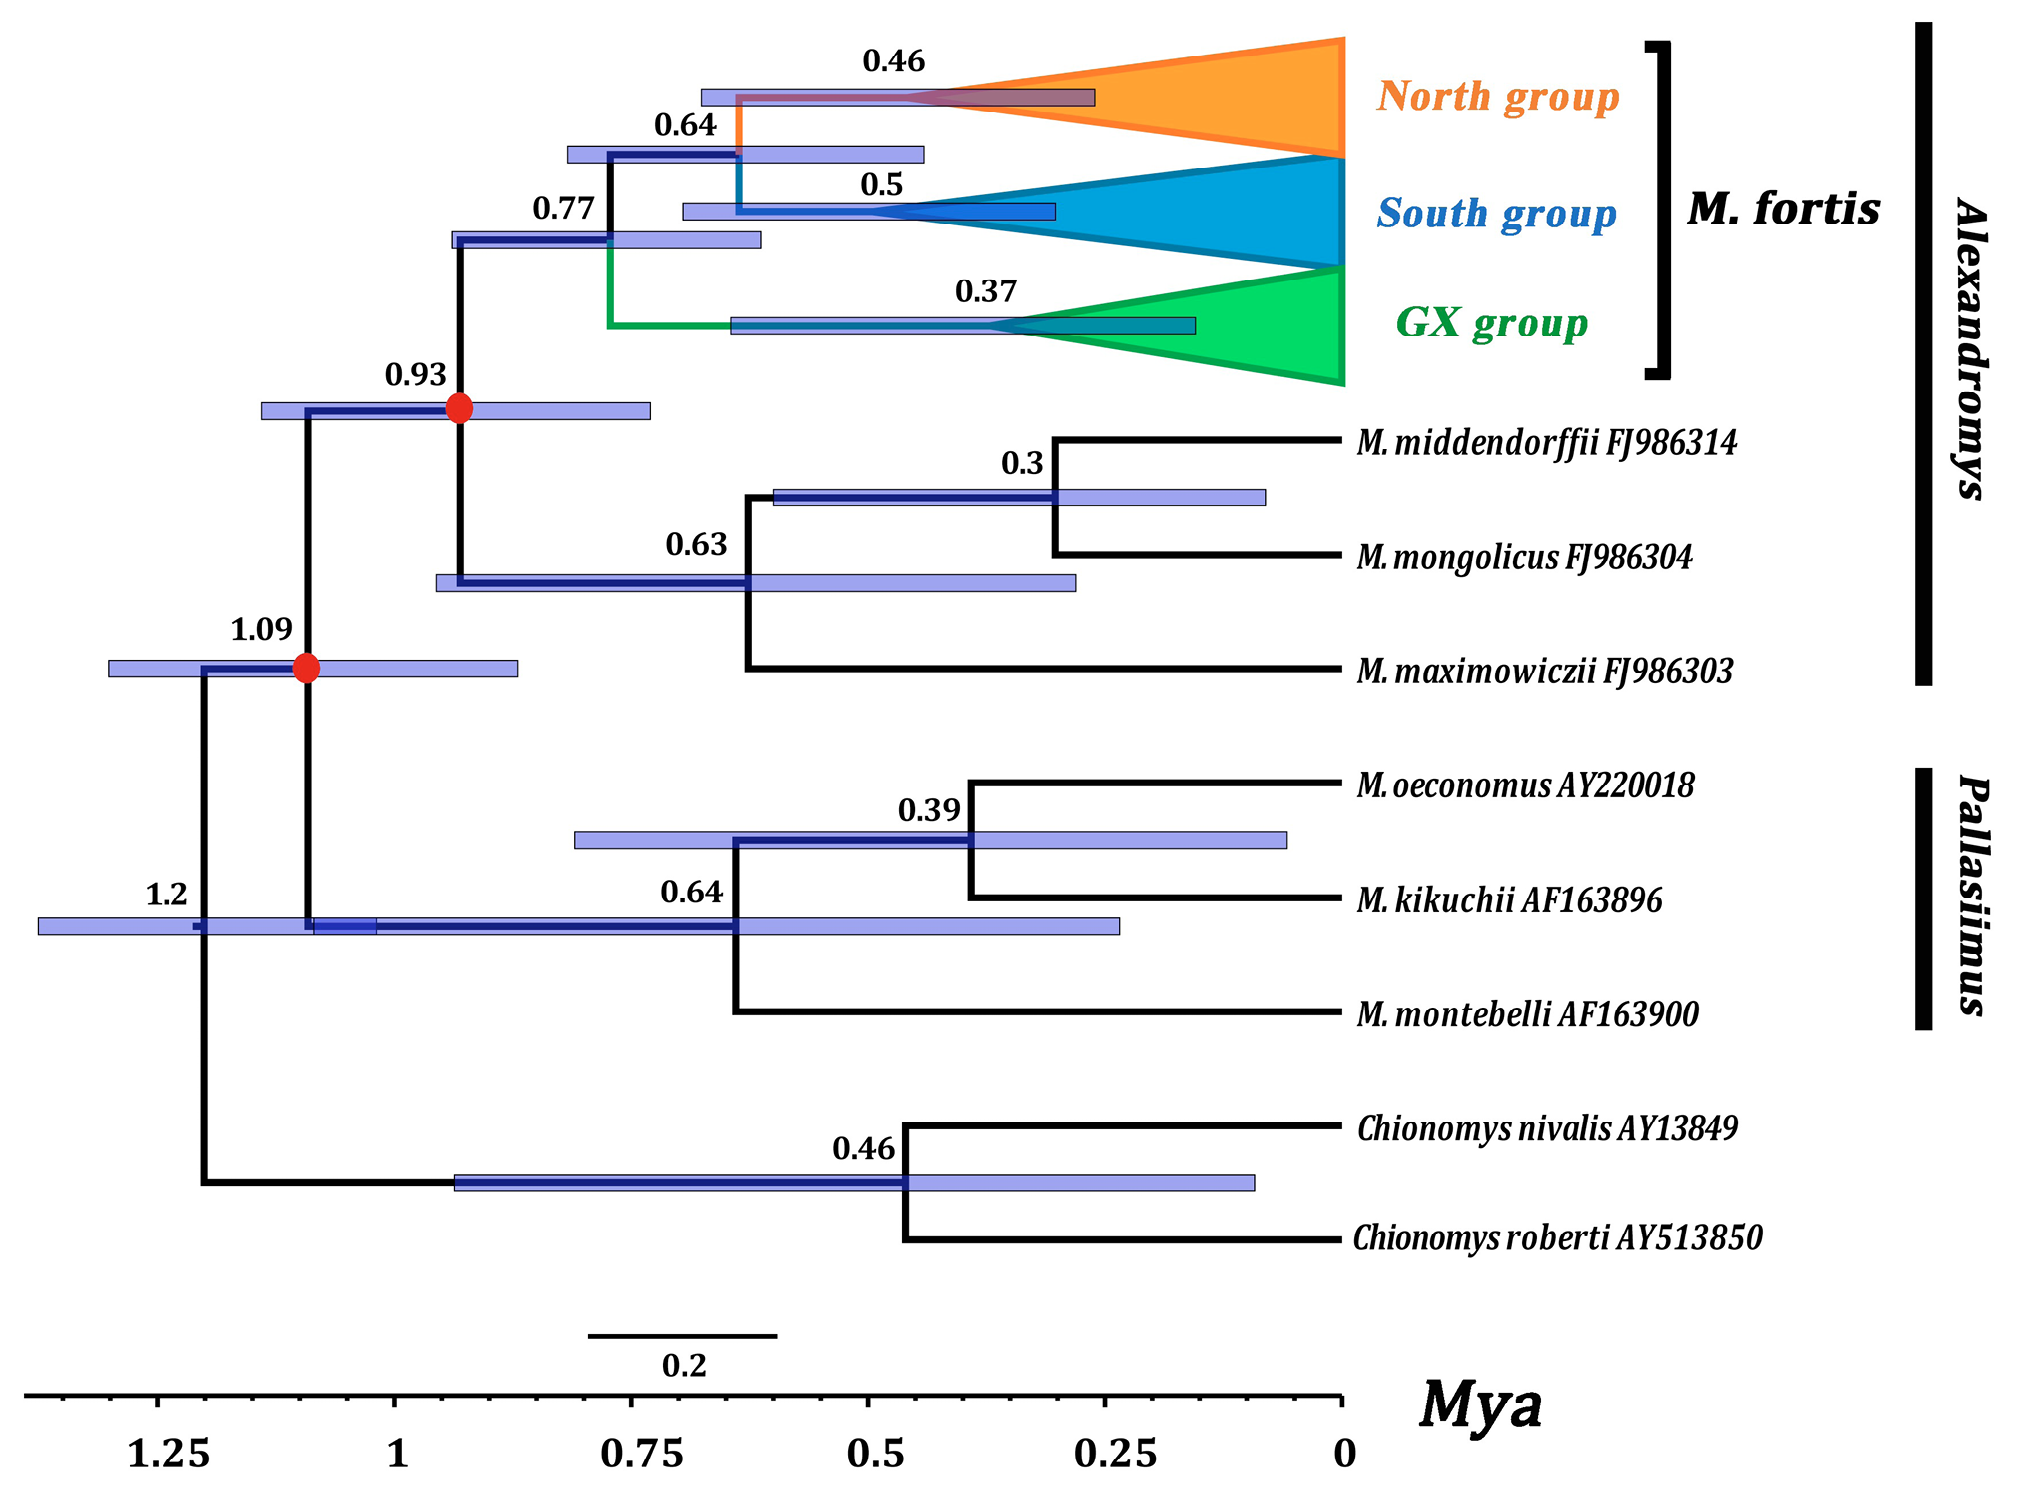
Chronogram of M. fortis based on 84 combined (cyt b+CR) sequences. Branch lengths represent time; Node bars indicate the 95% CI for clade ages; Two red dots indicated the nodes for calibration point in this study.
Chronogram of M. fortis based on 84 combined (cyt b+CR) sequences. Branch lengths represent time; Node bars indicate the 95% CI for clade ages; Two red dots indicated the nodes for calibration point in this study.