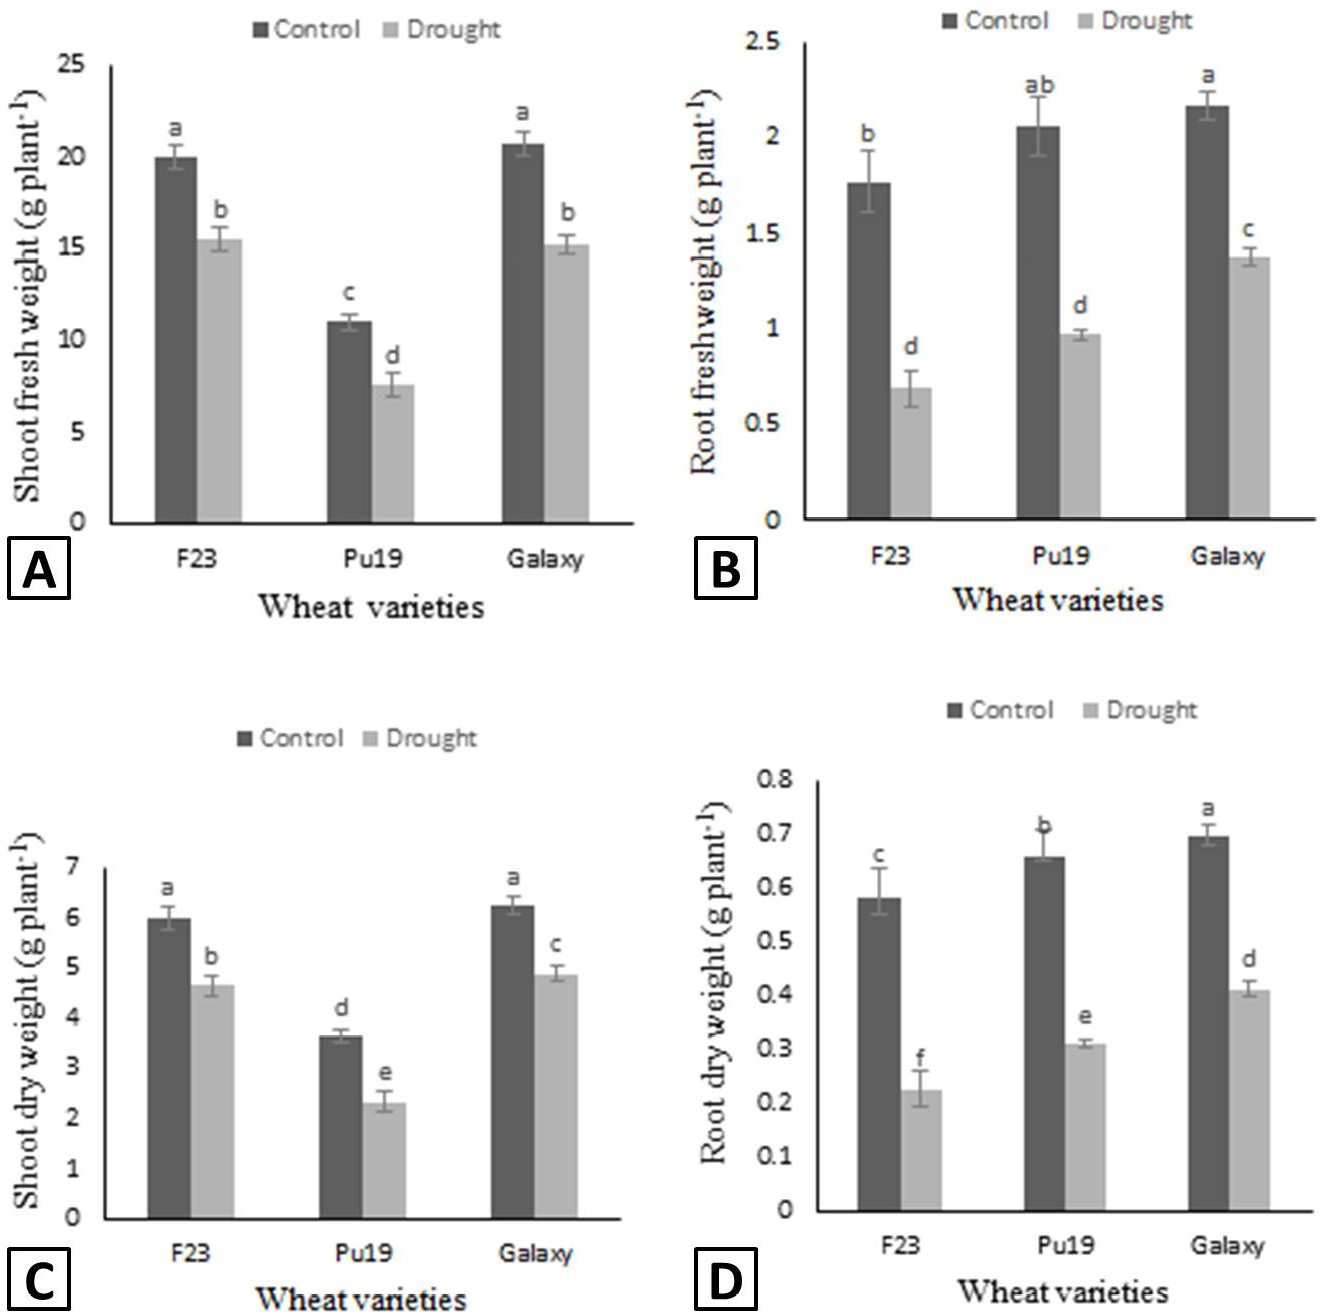
Figure 2:
Fresh weight of shoot (A), fresh weight of root (B), dry weight of shoot (C) and dry weight of root (D) of wheat varieties grown under control and drought condition. Different letters show the significant differences calculated by LSD at p<0.05. The data presented are mean values ± standard error of four replicates.