
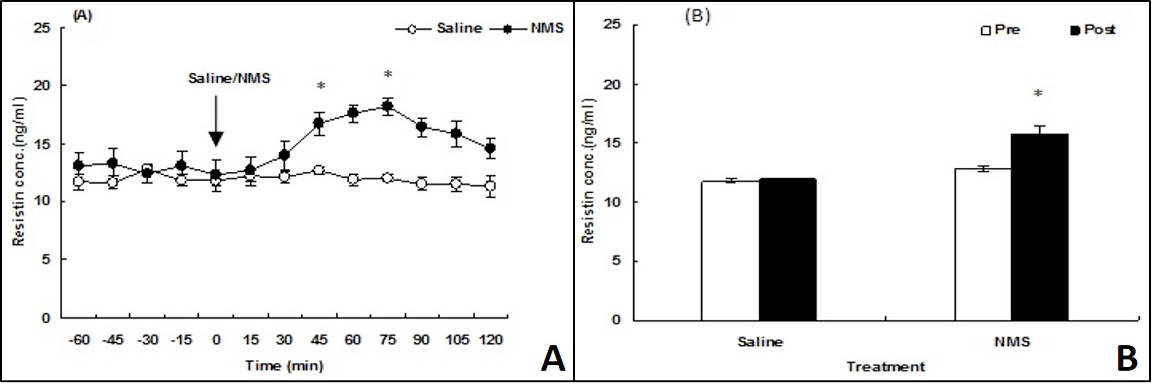
Figure 6
A, Mean (±SEM) changes in plasma resistin levels (ng/ml) before and after saline/NMS administration (at 0 min) in 48 h fasting adult male monkeys. *p<0.05 vs 0 min sample (ANOVA followed by post hoc Dunnett’s test). B, Comparison of mean (±SEM) plasma resistin levels (ng/ml) in 60 min pre- and 120 min post saline/NMS in 48 h fasting adult male monkeys. *P<0.05 vs pre-treatment (Student’s t test).