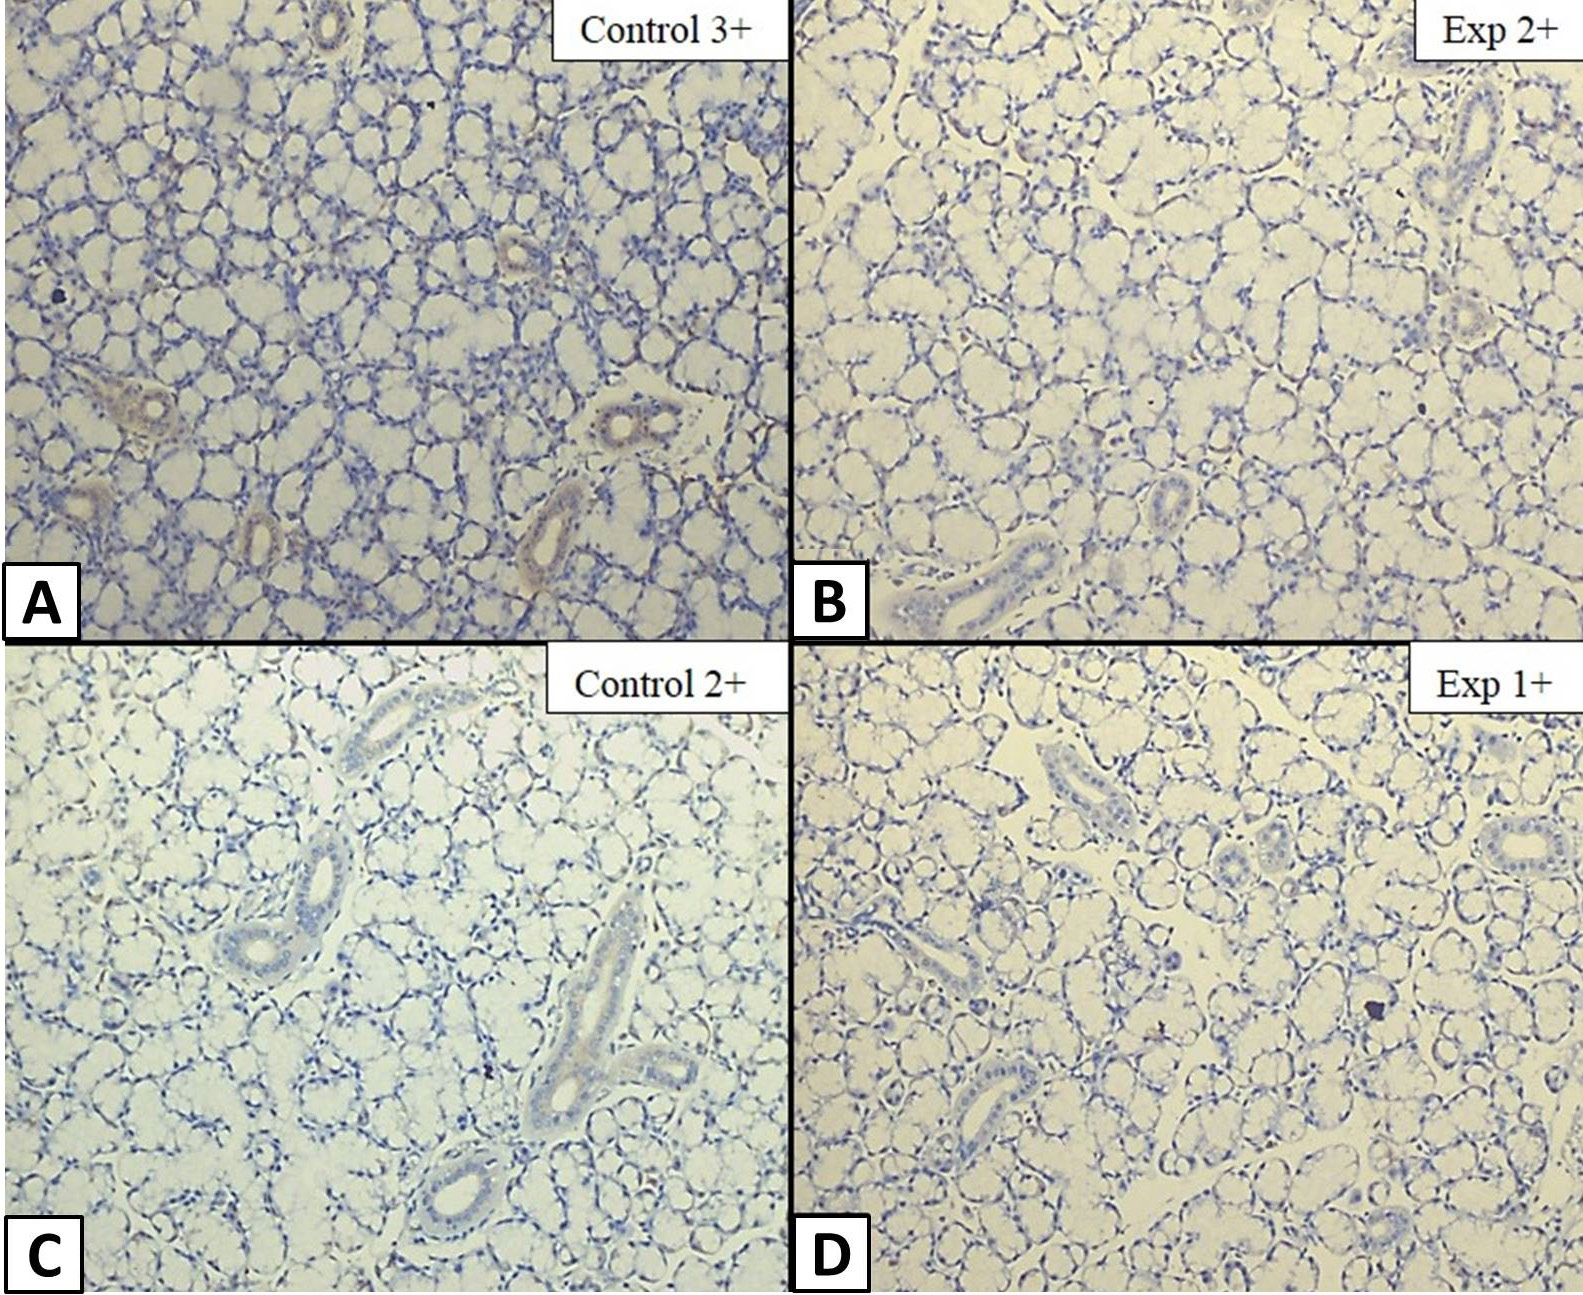
Fig. 2.
TGF-α expression in SLG of group A1 and B1 at week 5. Longitudinal section of ductal epithelium of SLG under 10x magnification showing A, Control group (A1) with TGF-α intensity score of positive (3+). B, Experimental group (B1) with TGF-α intensity score of weakly positive (2+). C, Control group (A1) with TGF-α intensity score of weakly positive (2+). D, Experimental group (B1) with TGF-α intensity score of minimally positive (1+).