
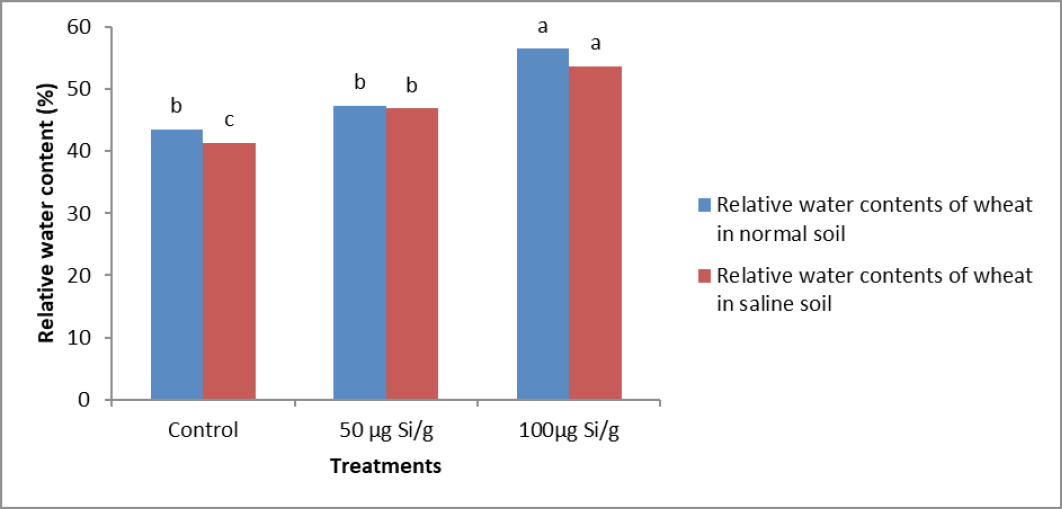
Figure 4:
Impact of various silicon concentrations on relative water content of wheat (%) under normal and salt affected soils.
Impact of various silicon concentrations on relative water content of wheat (%) under normal and salt affected soils.