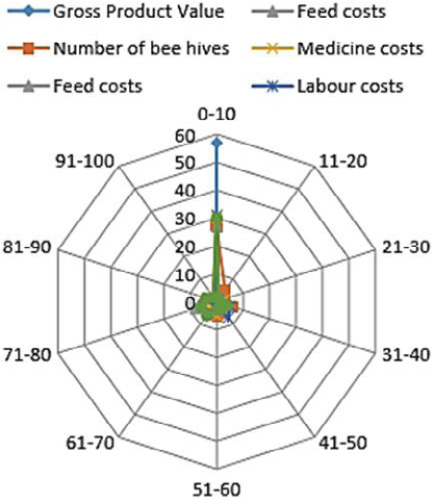
Distribution of the beekeeping farms by input/output potential improvement rates (%) in input-oriented VRS model.