
Fig. 3.
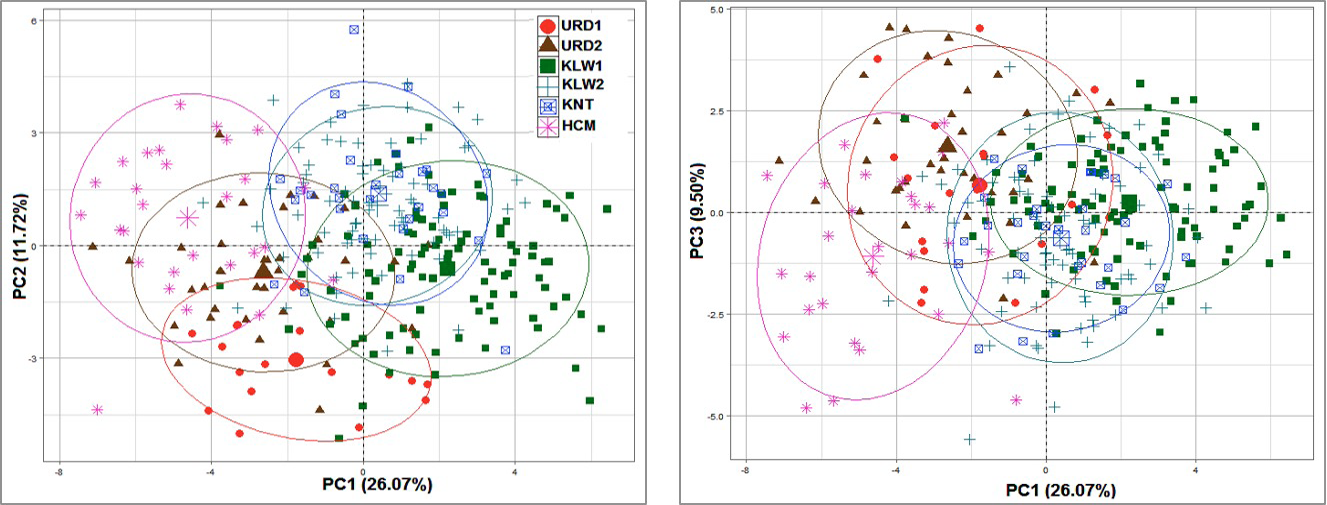
Bivariate scatterplots of Cyclocheilichthys apogon individuals along PC1-PC2 and PC1-PC3 axes of principal component analysis (PCA) for testing morphological variations among populations.
Bivariate scatterplots of Cyclocheilichthys apogon individuals along PC1-PC2 and PC1-PC3 axes of principal component analysis (PCA) for testing morphological variations among populations.