
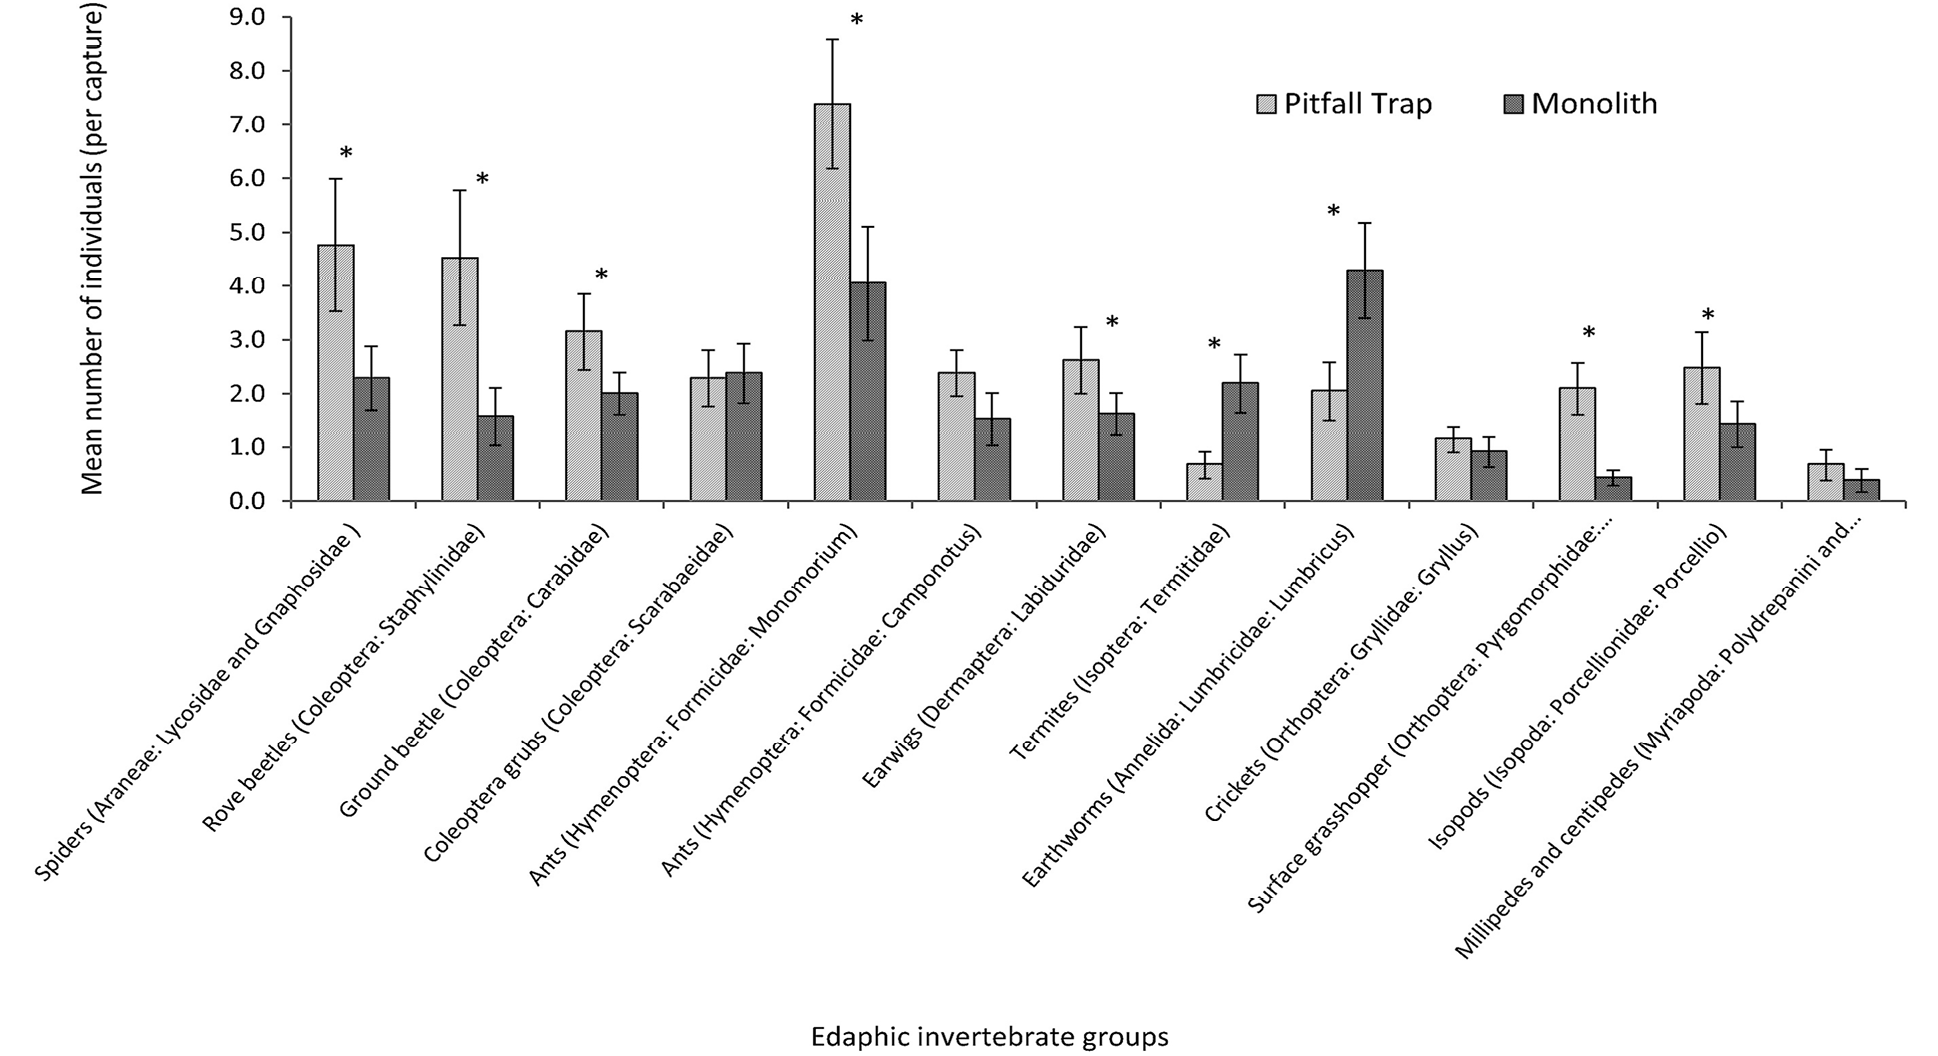
Fig. 4.
Comparison of mean population abundance (±SE) of different edaphic macroinvertebrates captured from various land-use types using pitfall traps and monolith method. For each macrofaunal group, bars with asterisk (*) sign are significantly different from each other (unpaired Student’s t-test at α = 0.05).