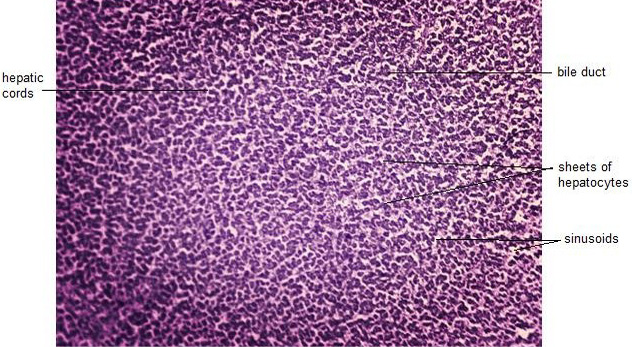
Figure 1:
Photomicrograph of T.S. of liver of group A (control group) showing compact hepatocytes, bile duct, hepatic cords and sinusoids, H and E, (40x).
Photomicrograph of T.S. of liver of group A (control group) showing compact hepatocytes, bile duct, hepatic cords and sinusoids, H and E, (40x).