
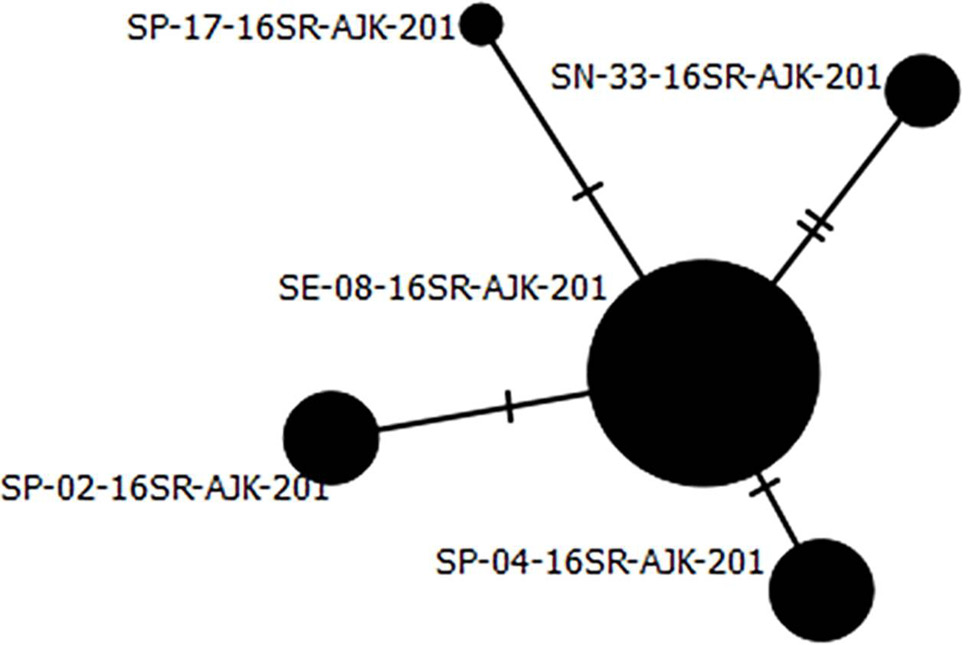
Fig. 3.
The minimum spanning network (MSN) of each population by pair-wise distance between each haplotype. Mutations were shown through hatch marks.
The minimum spanning network (MSN) of each population by pair-wise distance between each haplotype. Mutations were shown through hatch marks.