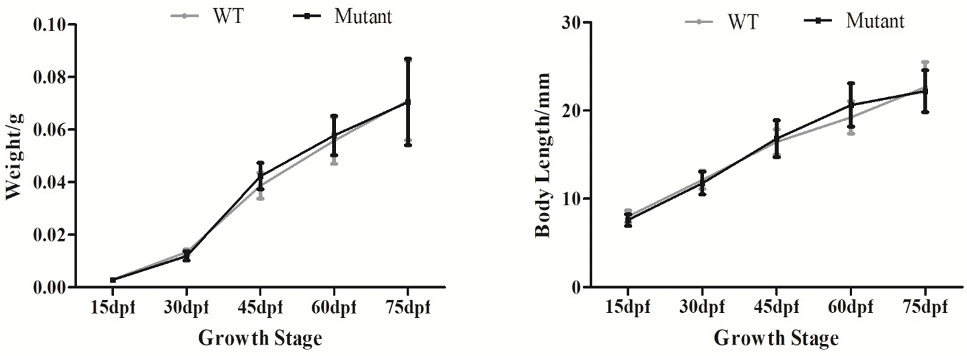
Fig. 4.
Growth curves of WT and imbs mutants at different development stages. Data are expressed as mean ± SD of body weight and length.
Growth curves of WT and imbs mutants at different development stages. Data are expressed as mean ± SD of body weight and length.