
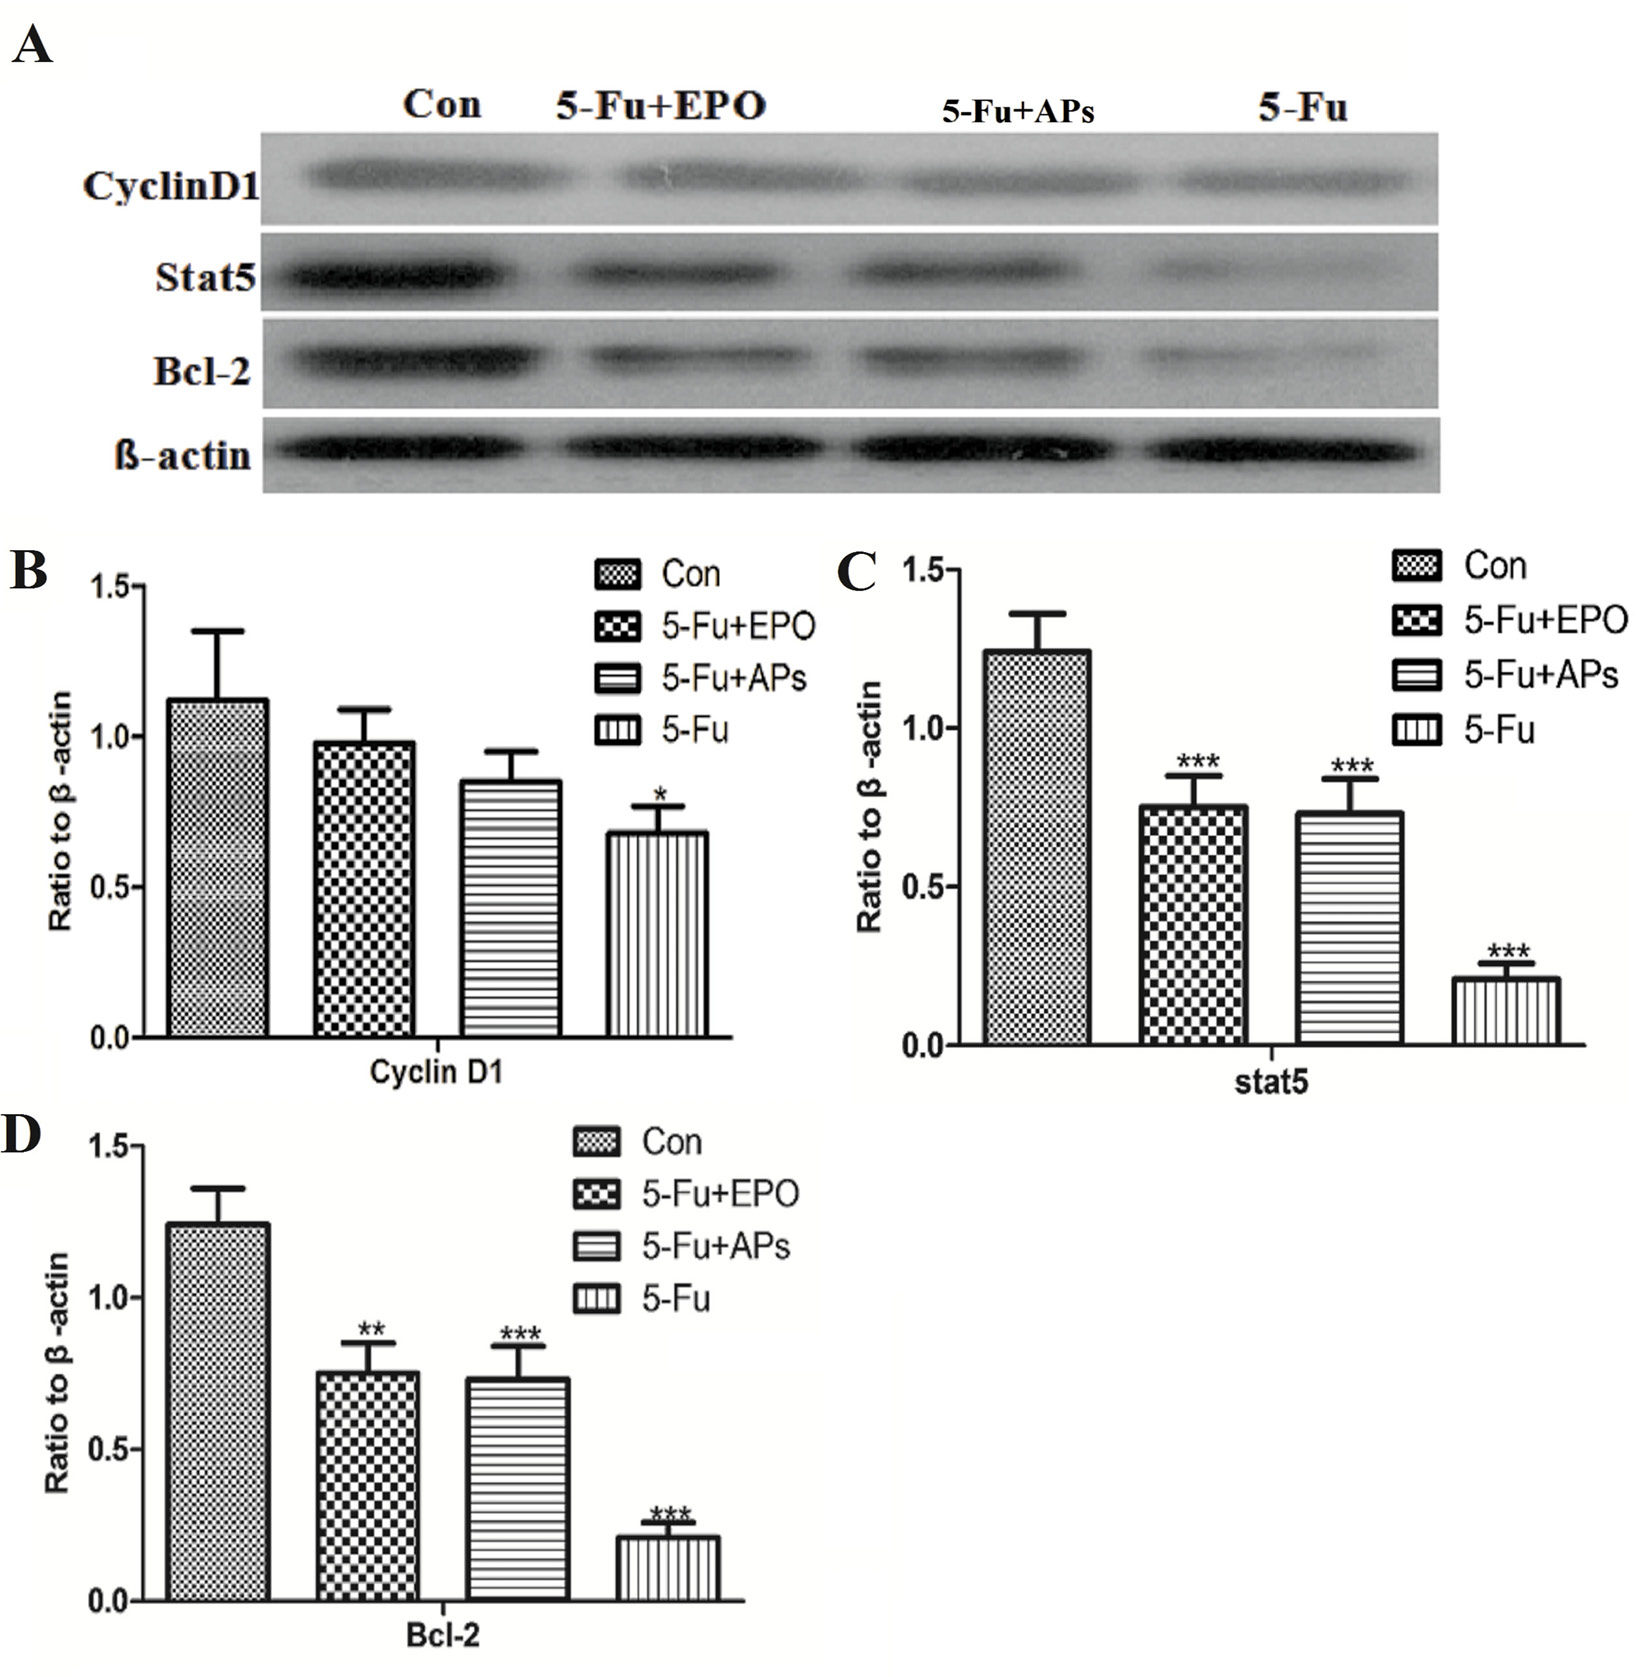
Fig. 4.
Expression levels of cyclin D1, Stat5, and Bcl-2 in peripheral blood cells. (A) Western blot analysis of the expression of cyclinD1, Stat5, and Bcl-2 in control, 5-Fluorouracil (5-Fu), 5-Fu+EPO and 5-Fu+APs groups. (B-D) β-actin was used as the internal control for grayscale analysis. Data are presented as the mean ± standard deviation; *P < 0.05, **P < 0.01, ***P < 0.001 versus the control group.