View larger version:
Download Original File
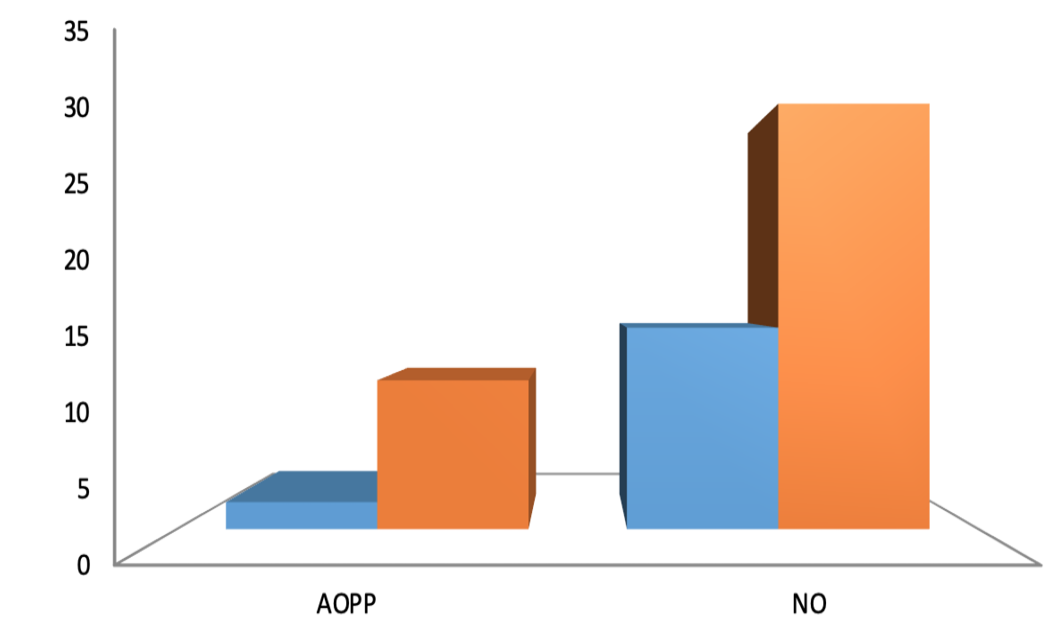
Figure 3:
Graphical representation of AOPP and NO in normal and RA patients.