
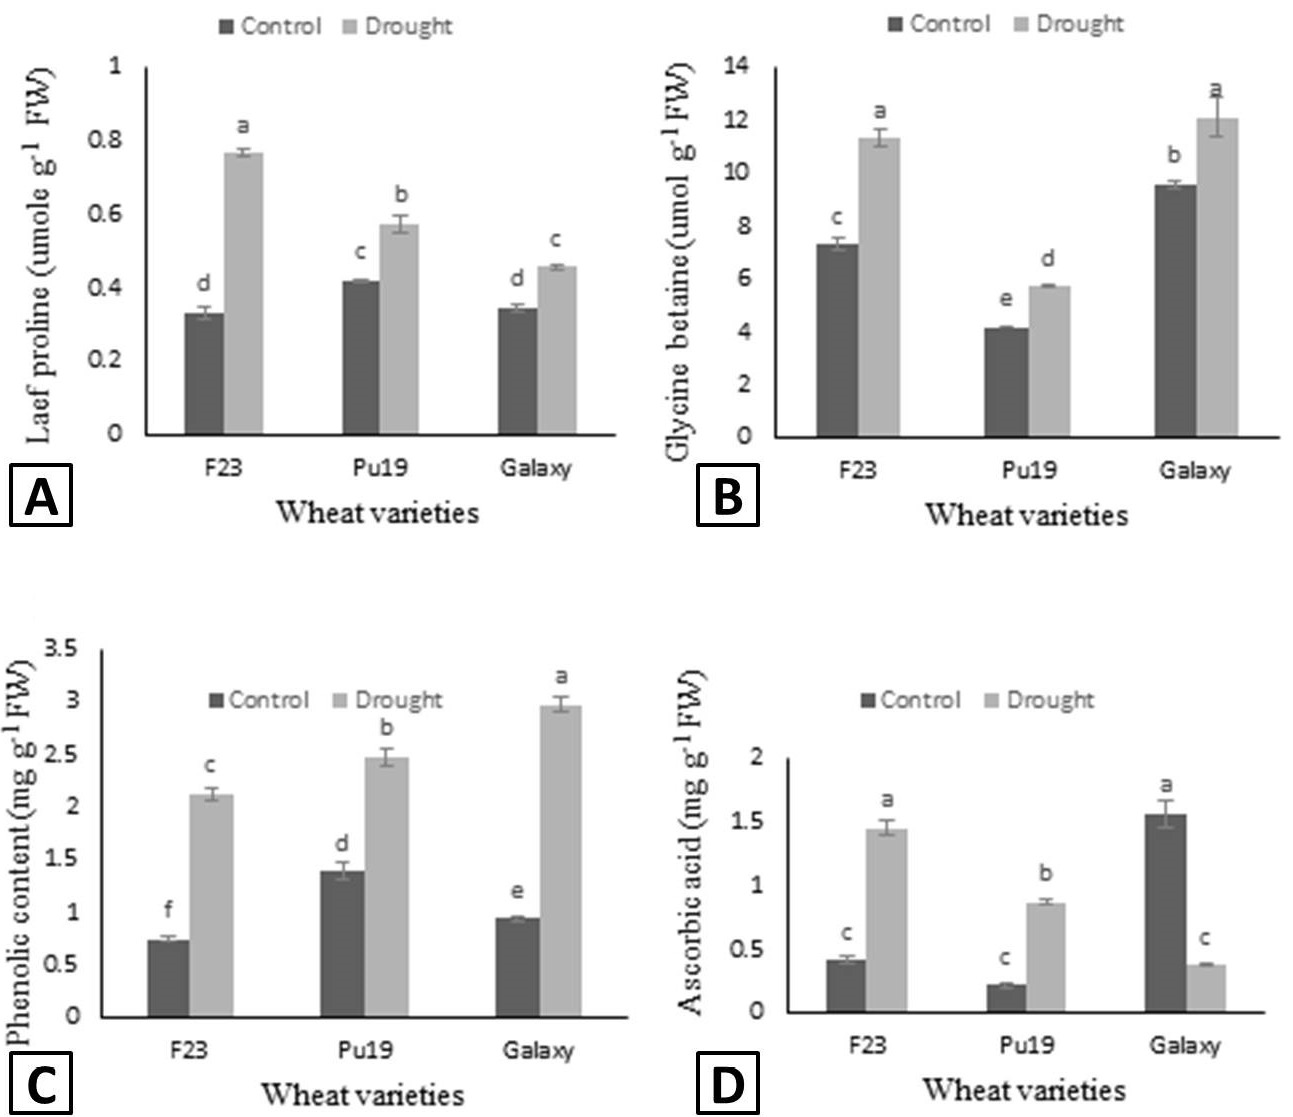
Figure 6:
Leaf proline (A), glycine betaine (B), phenolic Contents (C) and ascorbic acid (D) of wheat varieties grown under control and drought condition. Different letters show the significant differences calculated by LSD at p<0.05. The data presented are mean values ± standard error of four replicates.