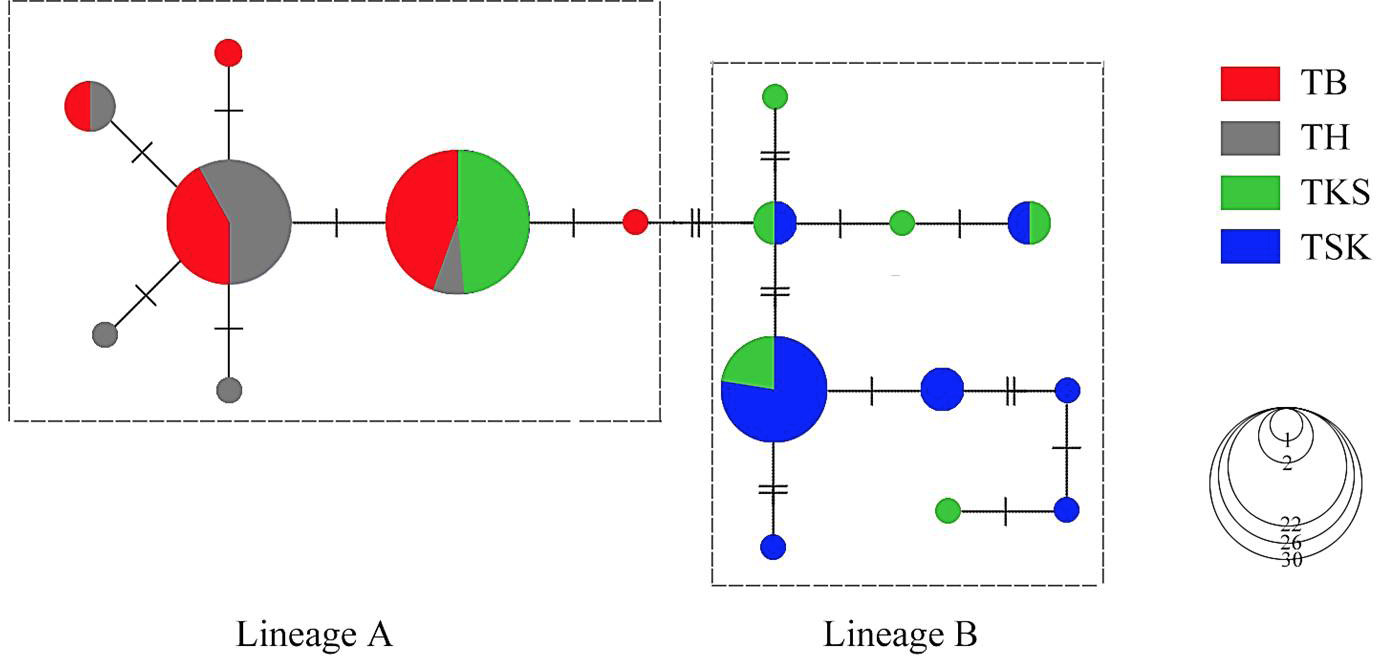
Fig. 3.
Unrooted minimum spanning tree depicting the genetic relationship among the Cytb haplotypes of P. minor. Circle sizes are proportional to the haplotype frequency. Perpendicular tick marks on the lines joining the haplotypes represent the number of nucleotide substitutions.