
Figure 1
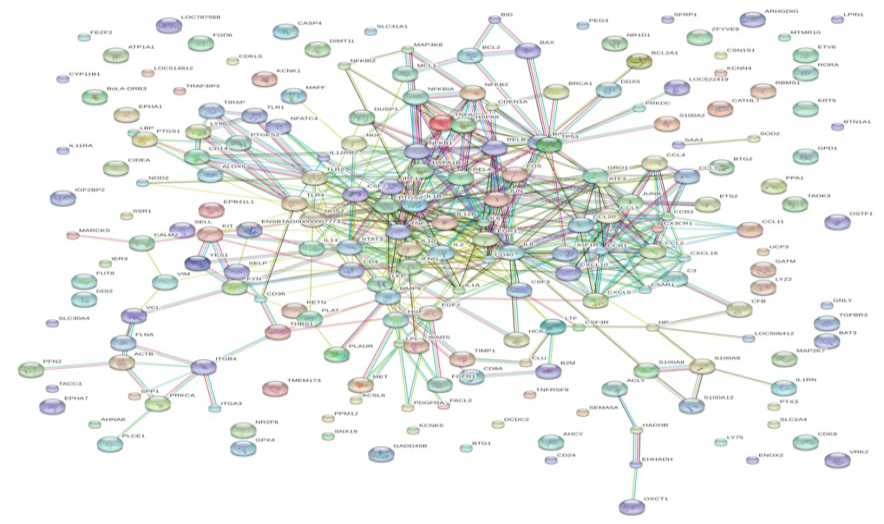
The network showing 3 clusters: In the center there is the largest network of the dataset; in the middle there is a second largest network of genes and at the sides scattered genes are shown that are not interconnected to any other gene in the provided dataset.