Fig. 2.
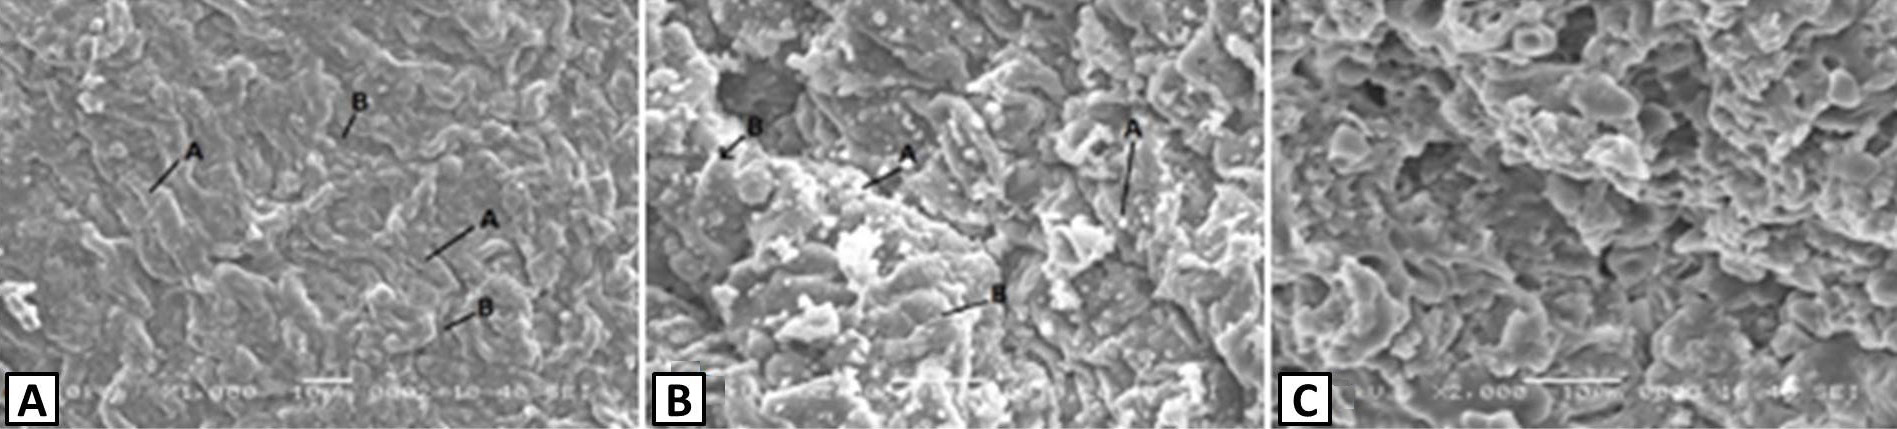
A Scanning electron micrograph of a liver section of a rabbit in the control group (A) CBZ treated group (B) CBZ and propranolol treated group (C).
A Scanning electron micrograph of a liver section of a rabbit in the control group (A) CBZ treated group (B) CBZ and propranolol treated group (C).