
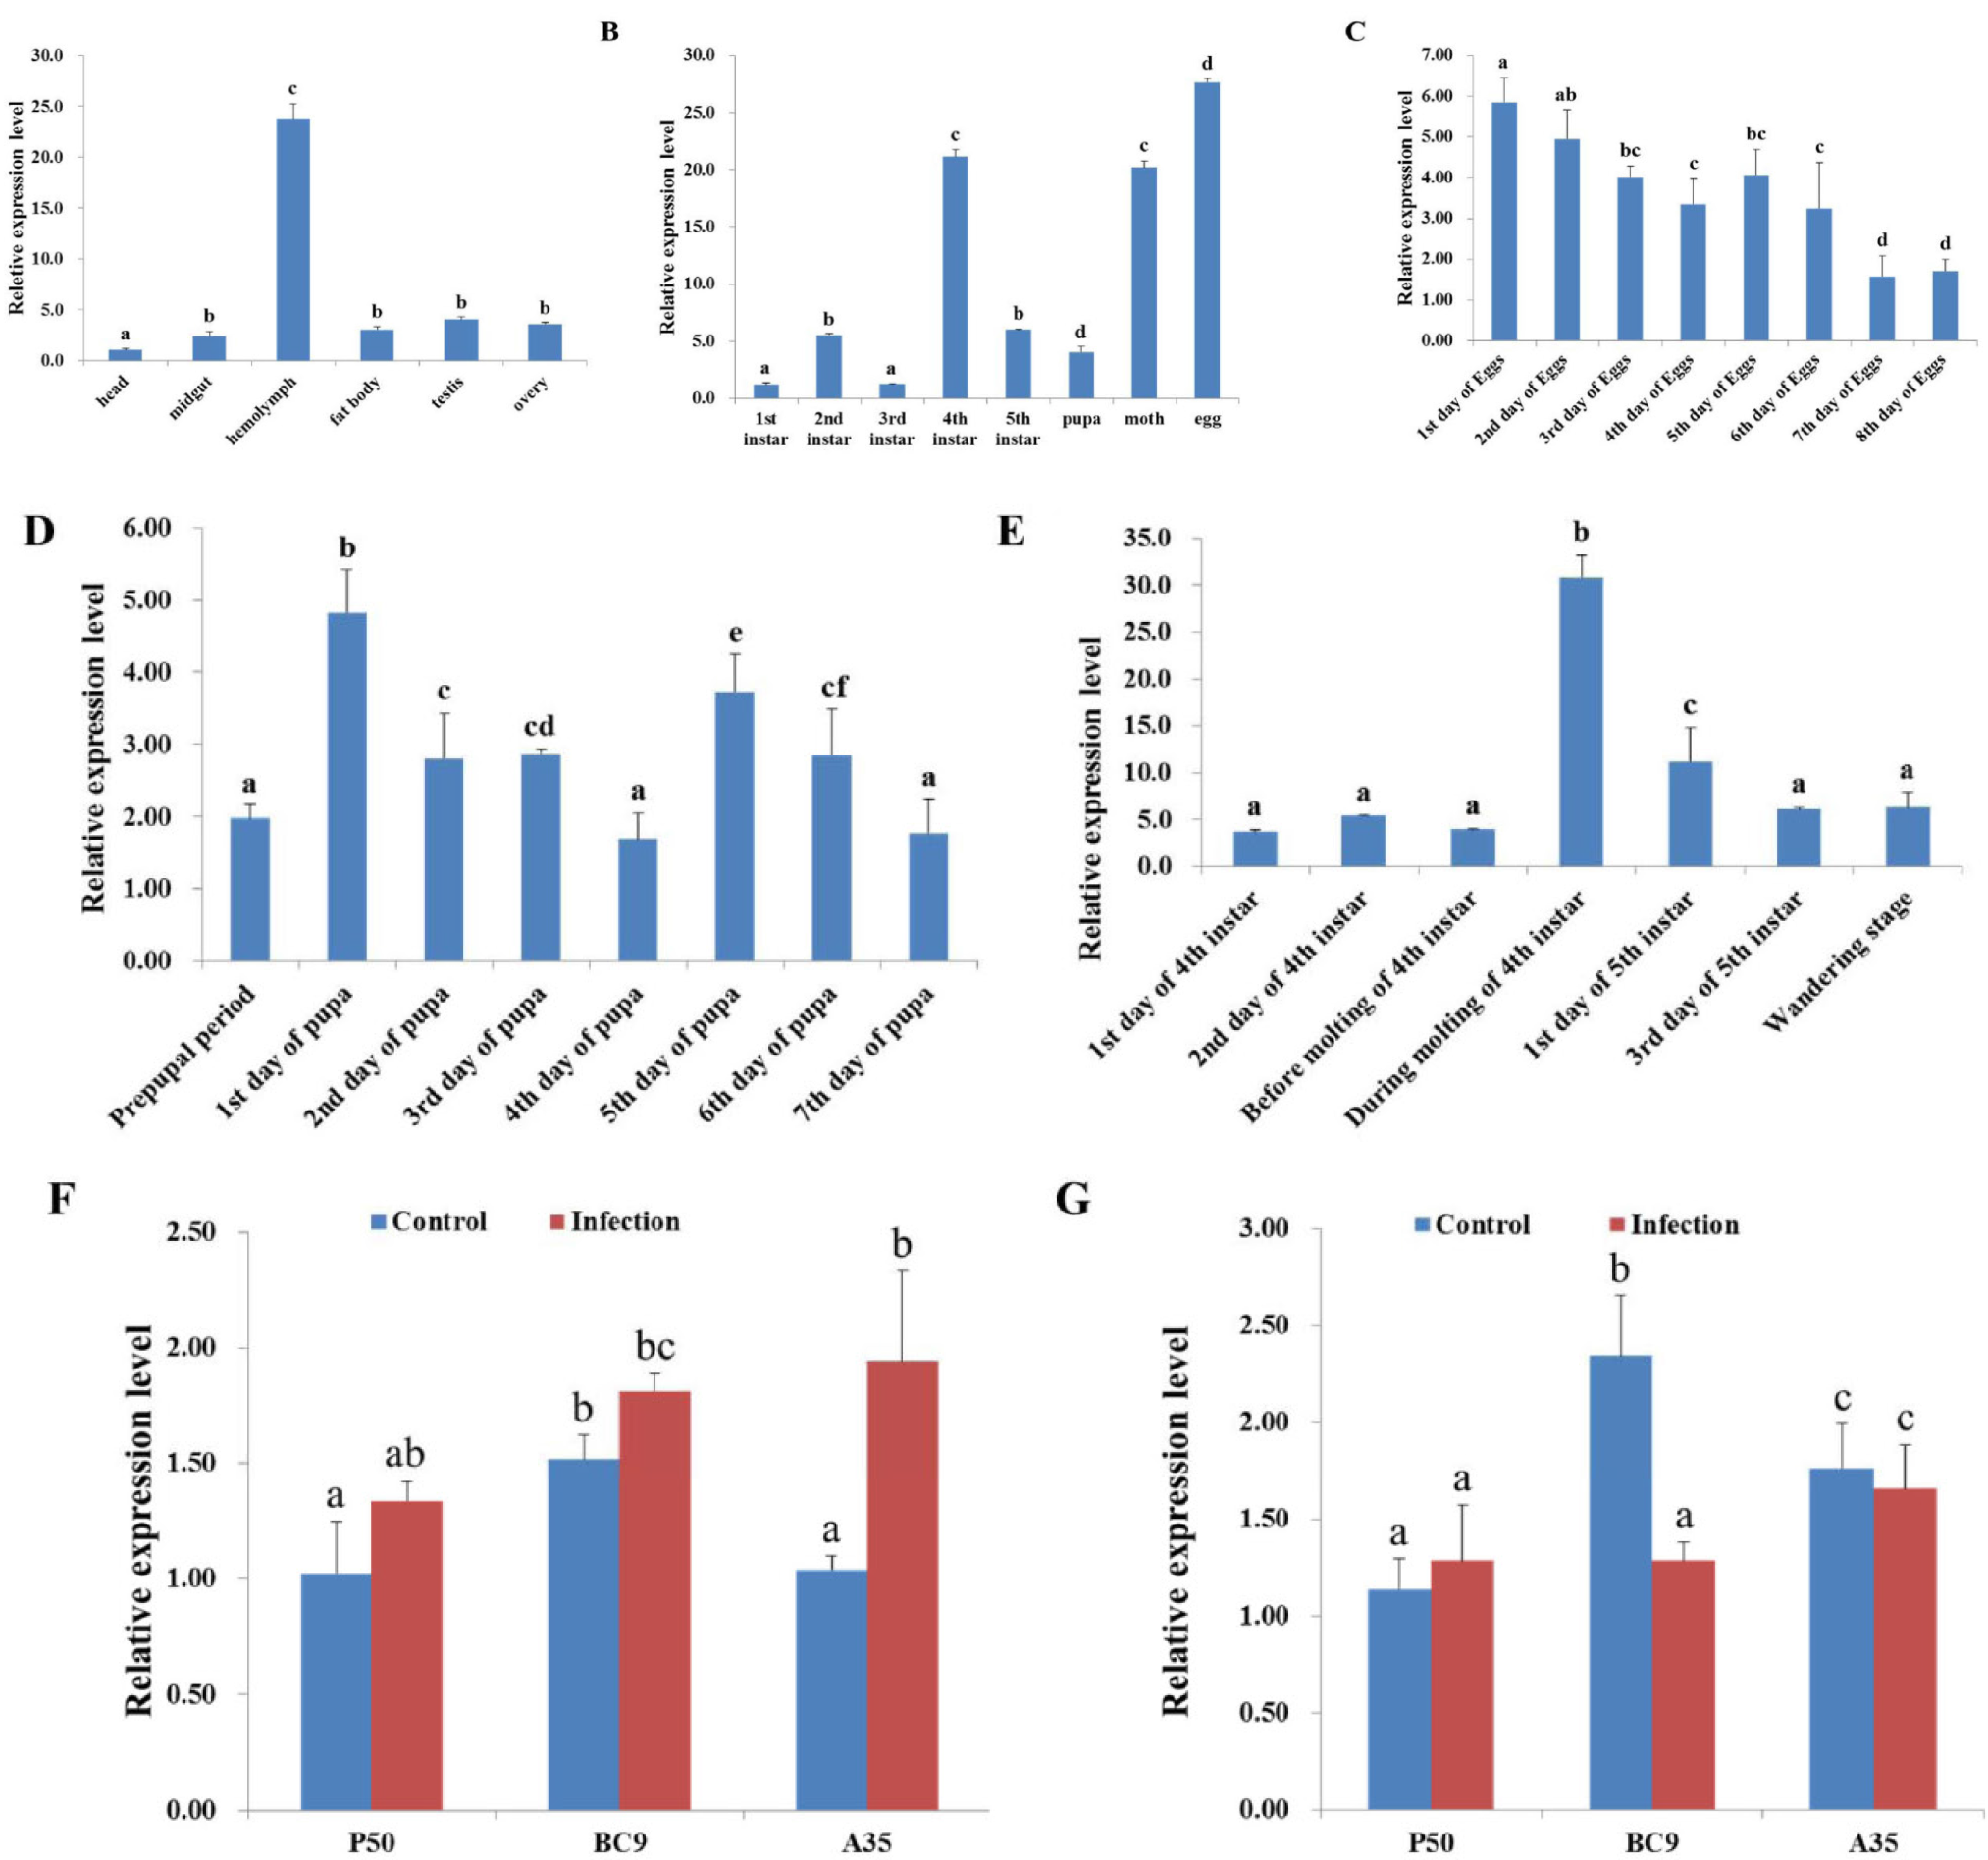
Fig. 4.
RT-qPCR analysis of the expression patterns of BmARM-like mRNA. A, B, C, D, and E show the expression patterns of BmARM-like in different silkworm tissues (A), different developmental stages (B), during egg development (C), during pupal development (D), and during molting (E). F and G show the expression patterns of BmARM-like in the midgut (F) and hemolymph (G) of different resistant silkworm strains following BmNPV infection. Data was normalized using BmGAPDH and is represented as mean ± standard error of the mean from three independent experiments. Different letters on the bars indicate statistically significant differences based on ANOVA followed by Tukey’s HSD multiple comparison test (p < 0.05).