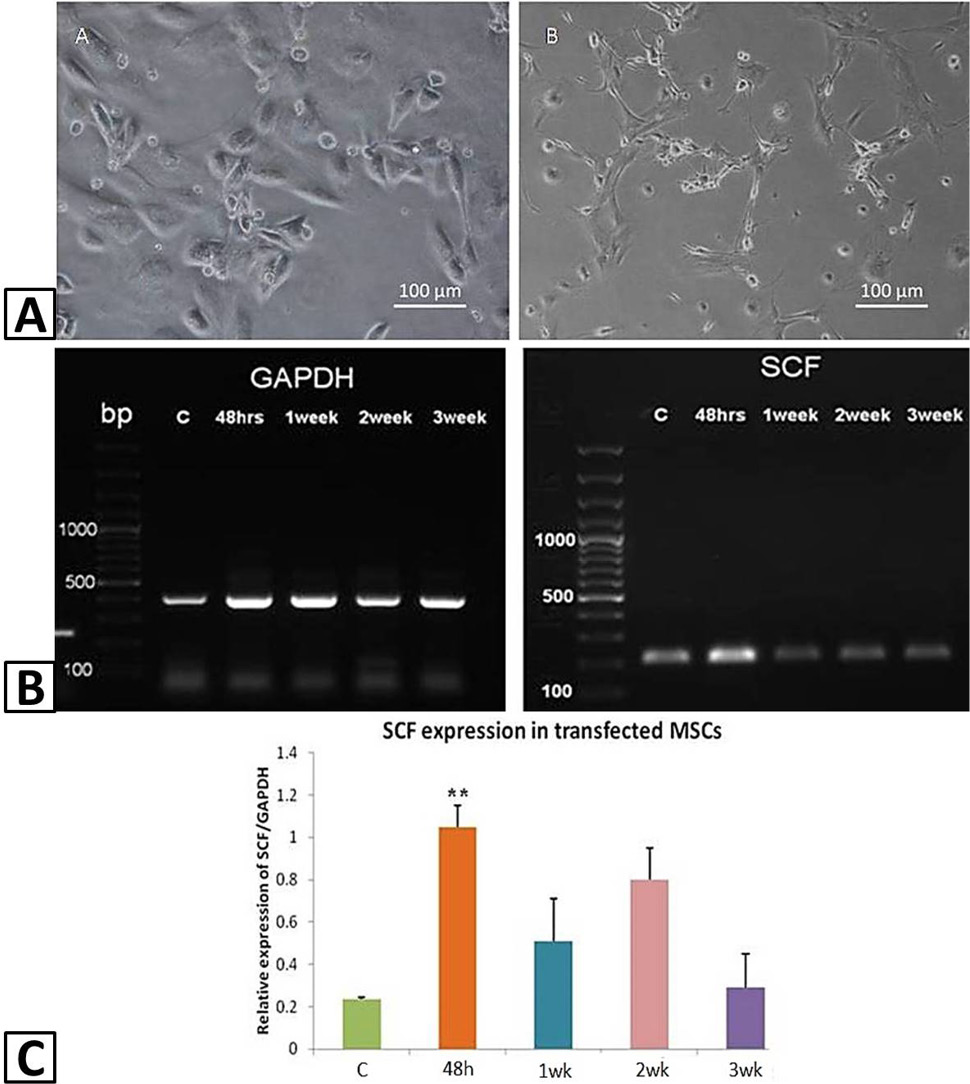
Fig. 2.
Transfection of MSCs with SCF: (A) Morphology of MSCs before and after transfection with SCF. Images were taken under phase contrast at 10X magnification; (B) Gene expression analysis of SCF transfected MSCs. RT-PCR gel showing gene expression levels of GAPDH and SCF after transfection. Lane 1: DNA marker (100 to 1500 bp); Lane 2 -5: SCF expression in normal MSCs, and SCF transfected MSCc after 48 h, 1 week, 2 weeks and 3 weeks, respectively. (C) Corresponding bar diagram with quantitative analysis of SCF expression in normal and transfected MSCs. Results are expressed as Mean ± SEM (n = 3). Differences between groups with P < 0.05 is considered statistically significant where *P < 0.05, **P < 0.01, and ***P < 0.001.