View larger version:
Download Original File
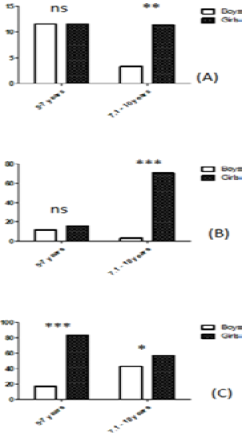
Figure 2:
Prevalence of underweight (A), stunting (B) and thinness (C) in boys vs girls in two age groups.