Figure 4
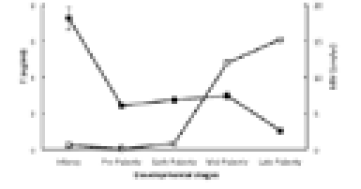
Correlation between the mean plasma concentrations of T (open squares) and LGV (closed squares) at infancy, pre-puberty, early, mid and late puberty in boys.
Correlation between the mean plasma concentrations of T (open squares) and LGV (closed squares) at infancy, pre-puberty, early, mid and late puberty in boys.