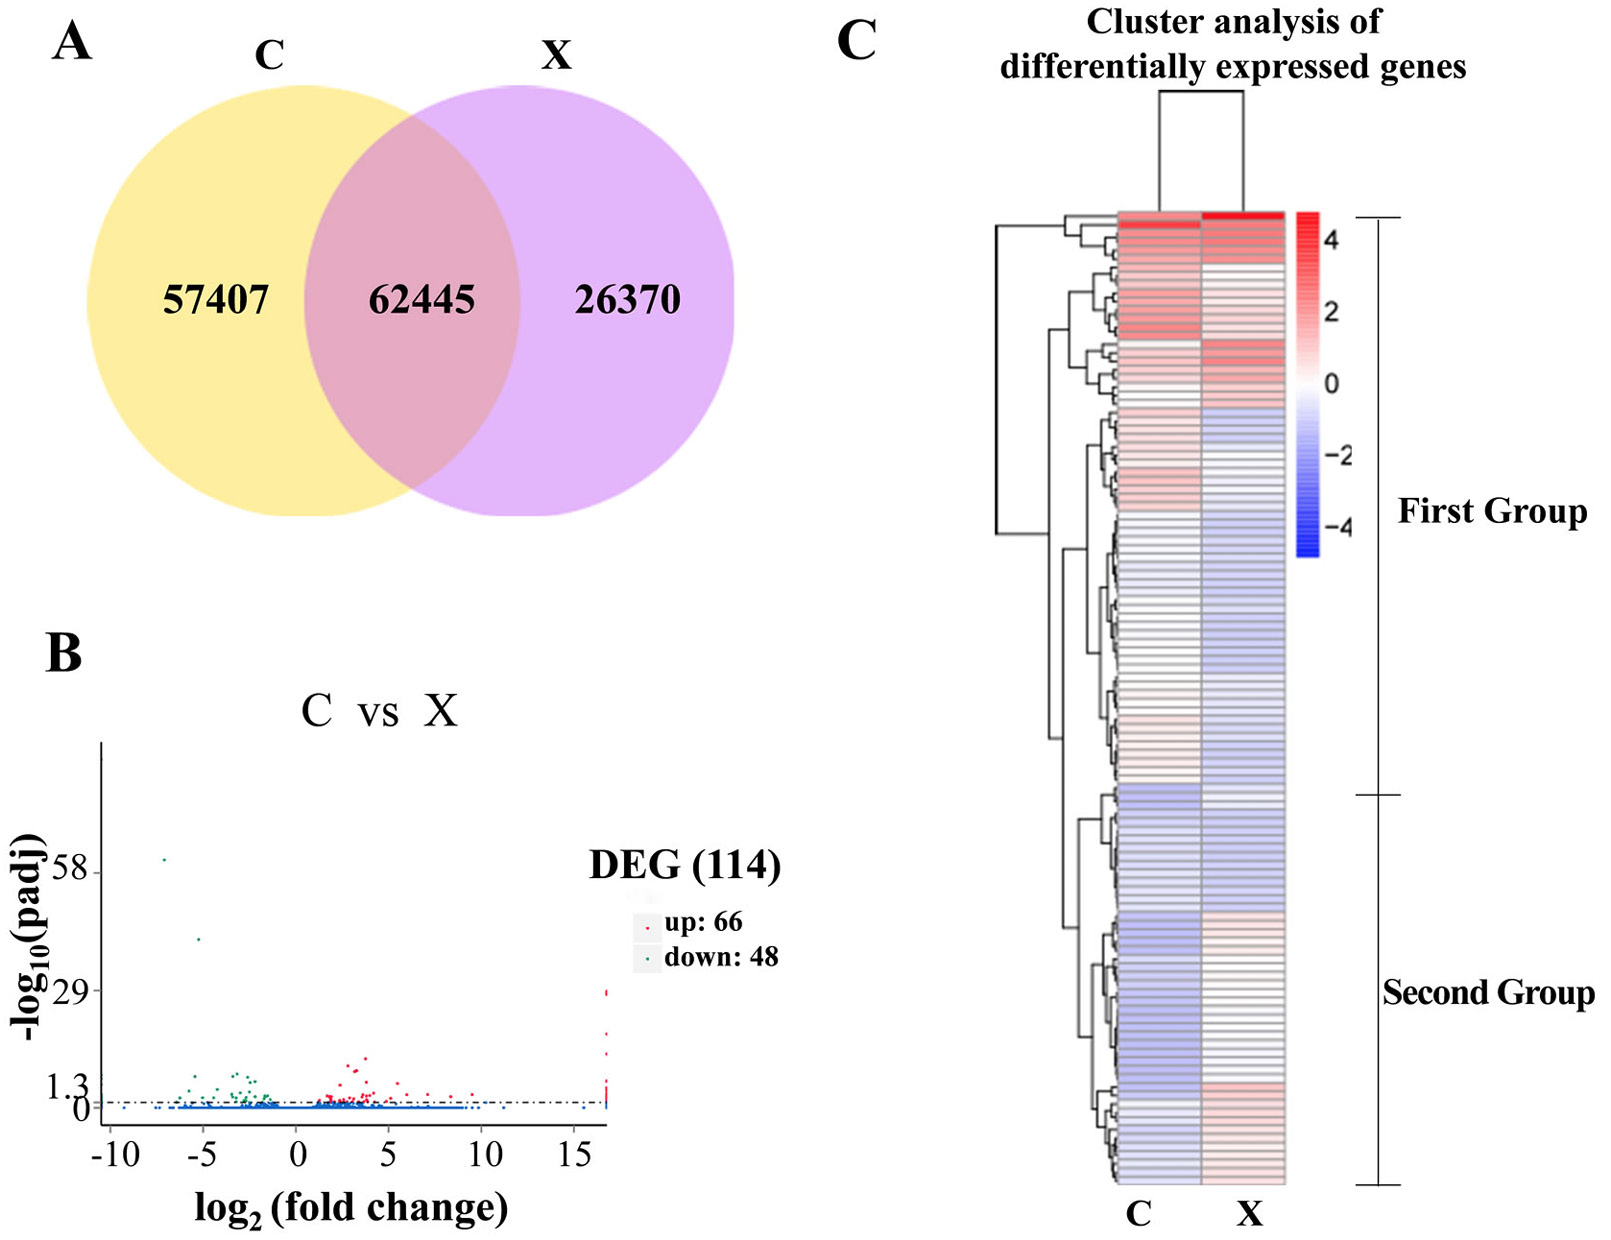
Fig. 6.
Bioinformatic analyses of differentially expressed genes (DEGs). A, Venn diagrams showing the number of genes expressed in the two groups; B, DEG distribution between the two treatment groups (C, Female; X, Male); C, cluster analysis of DEGs.