
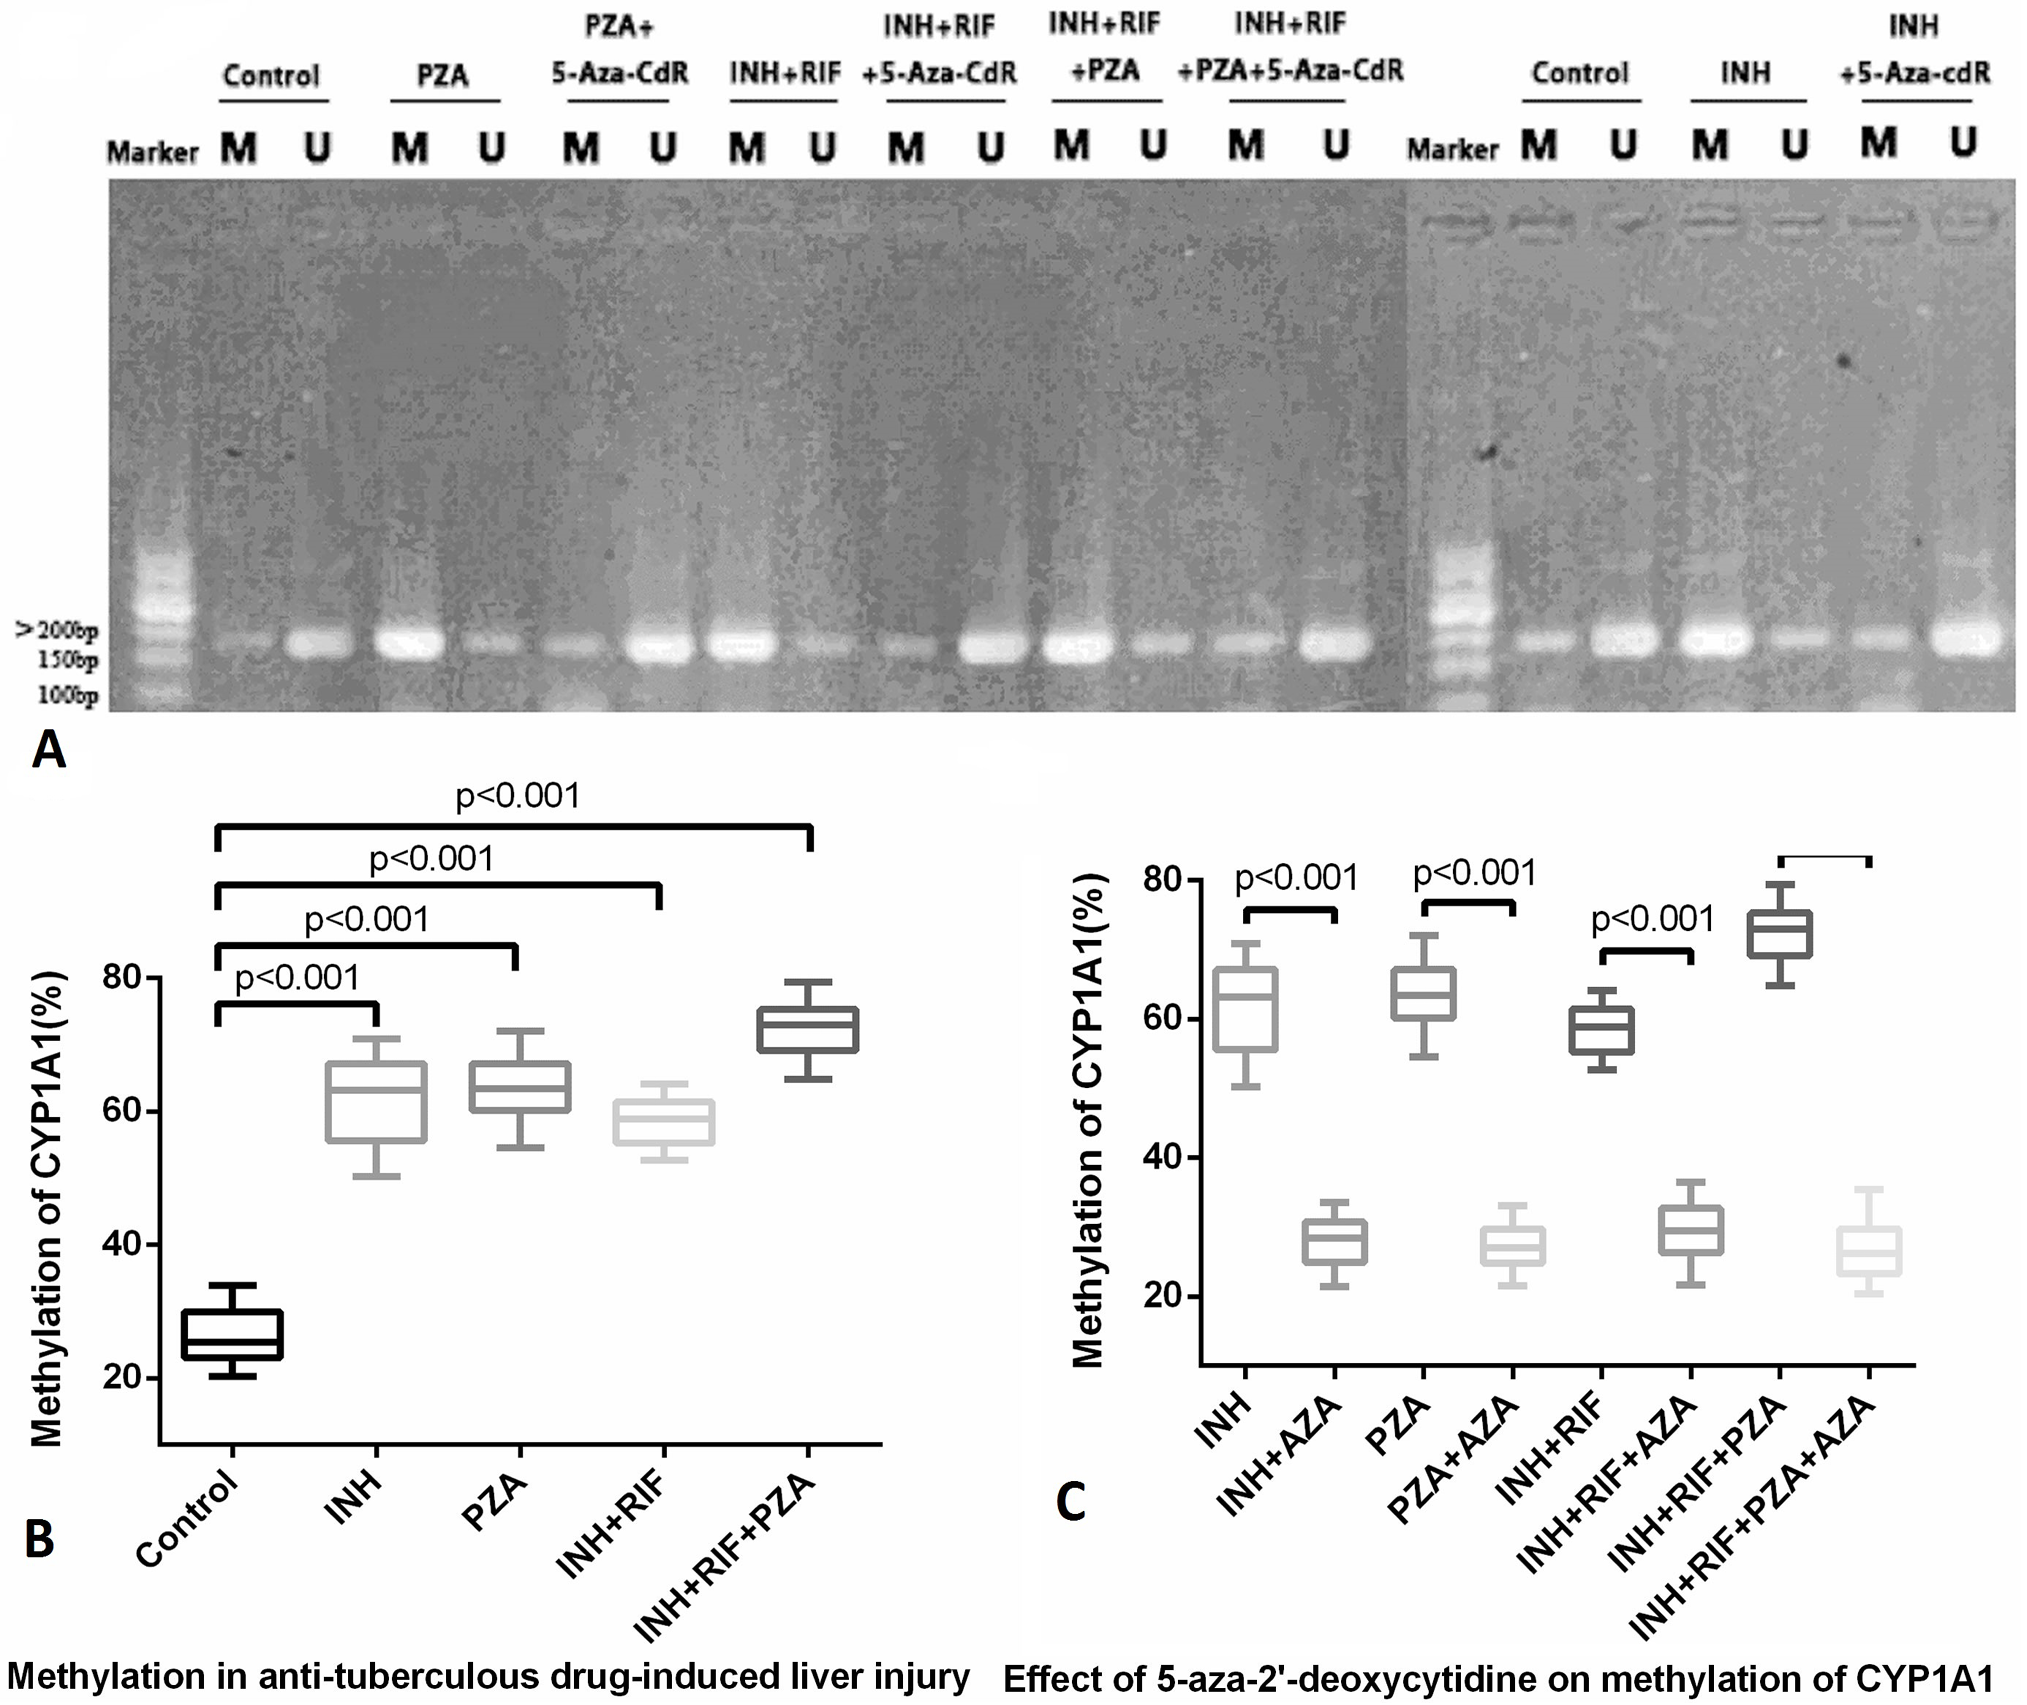
Fig. 1.
Methylation of CpG islands in the promoter region of the CYP1A1 gene in different drug groups. (A) Methylation of CpG islands in the CYP1A1 promoter region of each group was detected by methylation-specific PCR (MSP). Here, M represents a methylated band and U represents an unmethylated band. Both bands are 194 bp in length. (B, C) MSP methylation, % = methylation OD/ (methylated OD + non-methylated OD) × 100%. Each group included 6 parallel samples.