
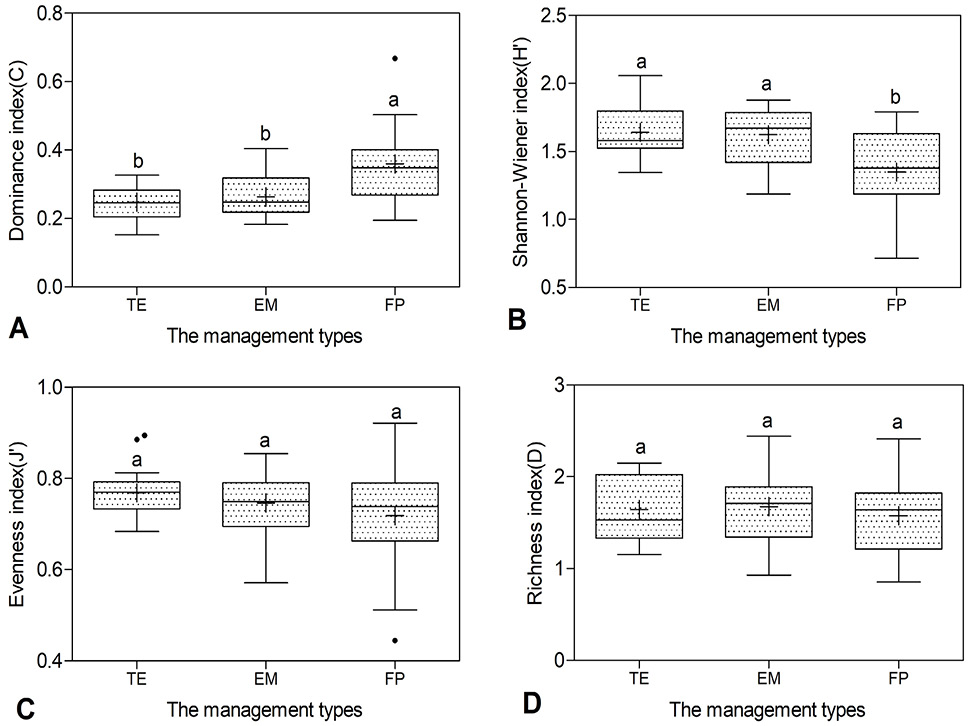
Fig. 5.
Boxplot of (A) Dominance index, (B) Shannon-Wiener index, (C) Evenness index, (D) Richness index; The differences of carabid community diversity indices among different types of interference were compared using the one-way ANOVA. Different letters above the boxes indicate significantly different means according to the Tukey test (P < 0.05).