View larger version:
Download Original File
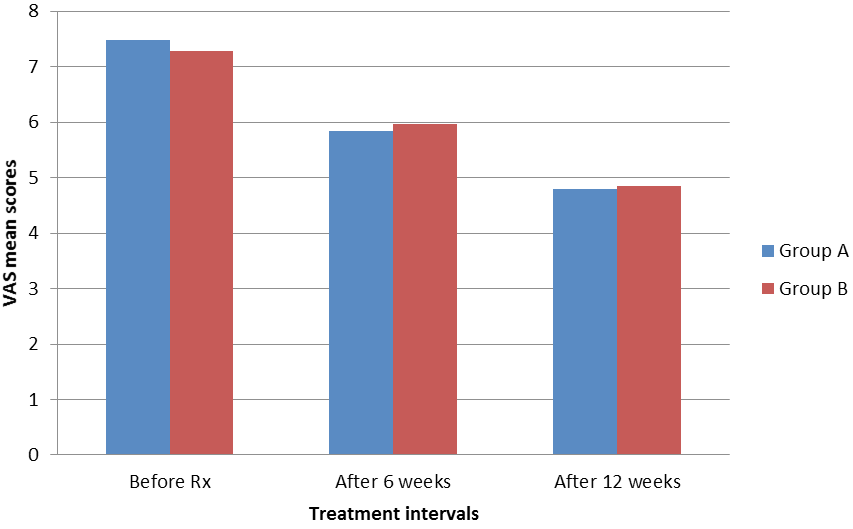
Figure 1
Comparison of means for vas of two groups at all three follow-ups.