View larger version:
Download Original File
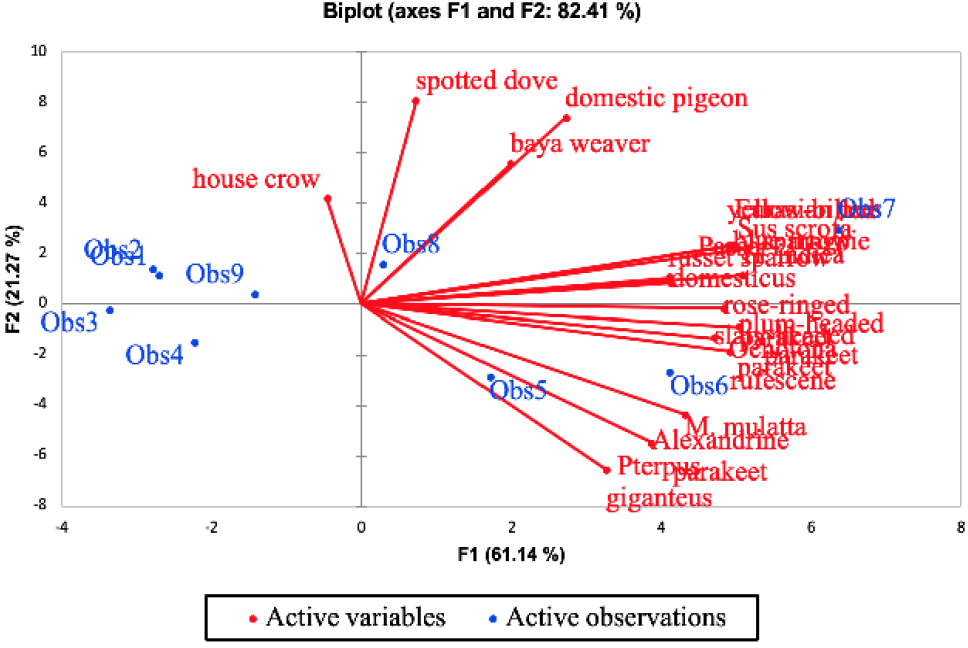
Fig. 3.
PCA plot showing the distribution of different species in study sites.