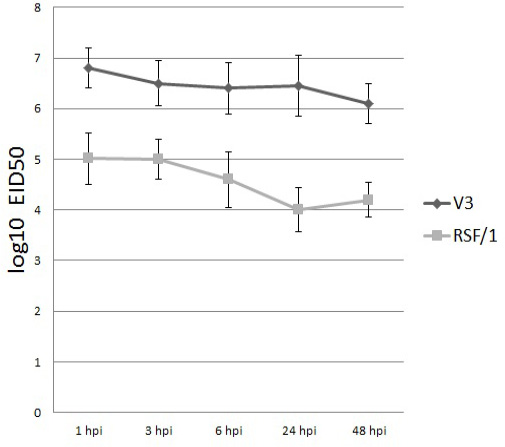
Figure 2
Viral titer of V3 (black column) and RSF/1 (gray column) in PBMCs culture supernatant at different time points. Viral titer measured by quantitative RT-real time PCR and expressed by log10 EID50. Data showed are the mean with error bar calculated from three replicates at each time point