View larger version:
Download Original File
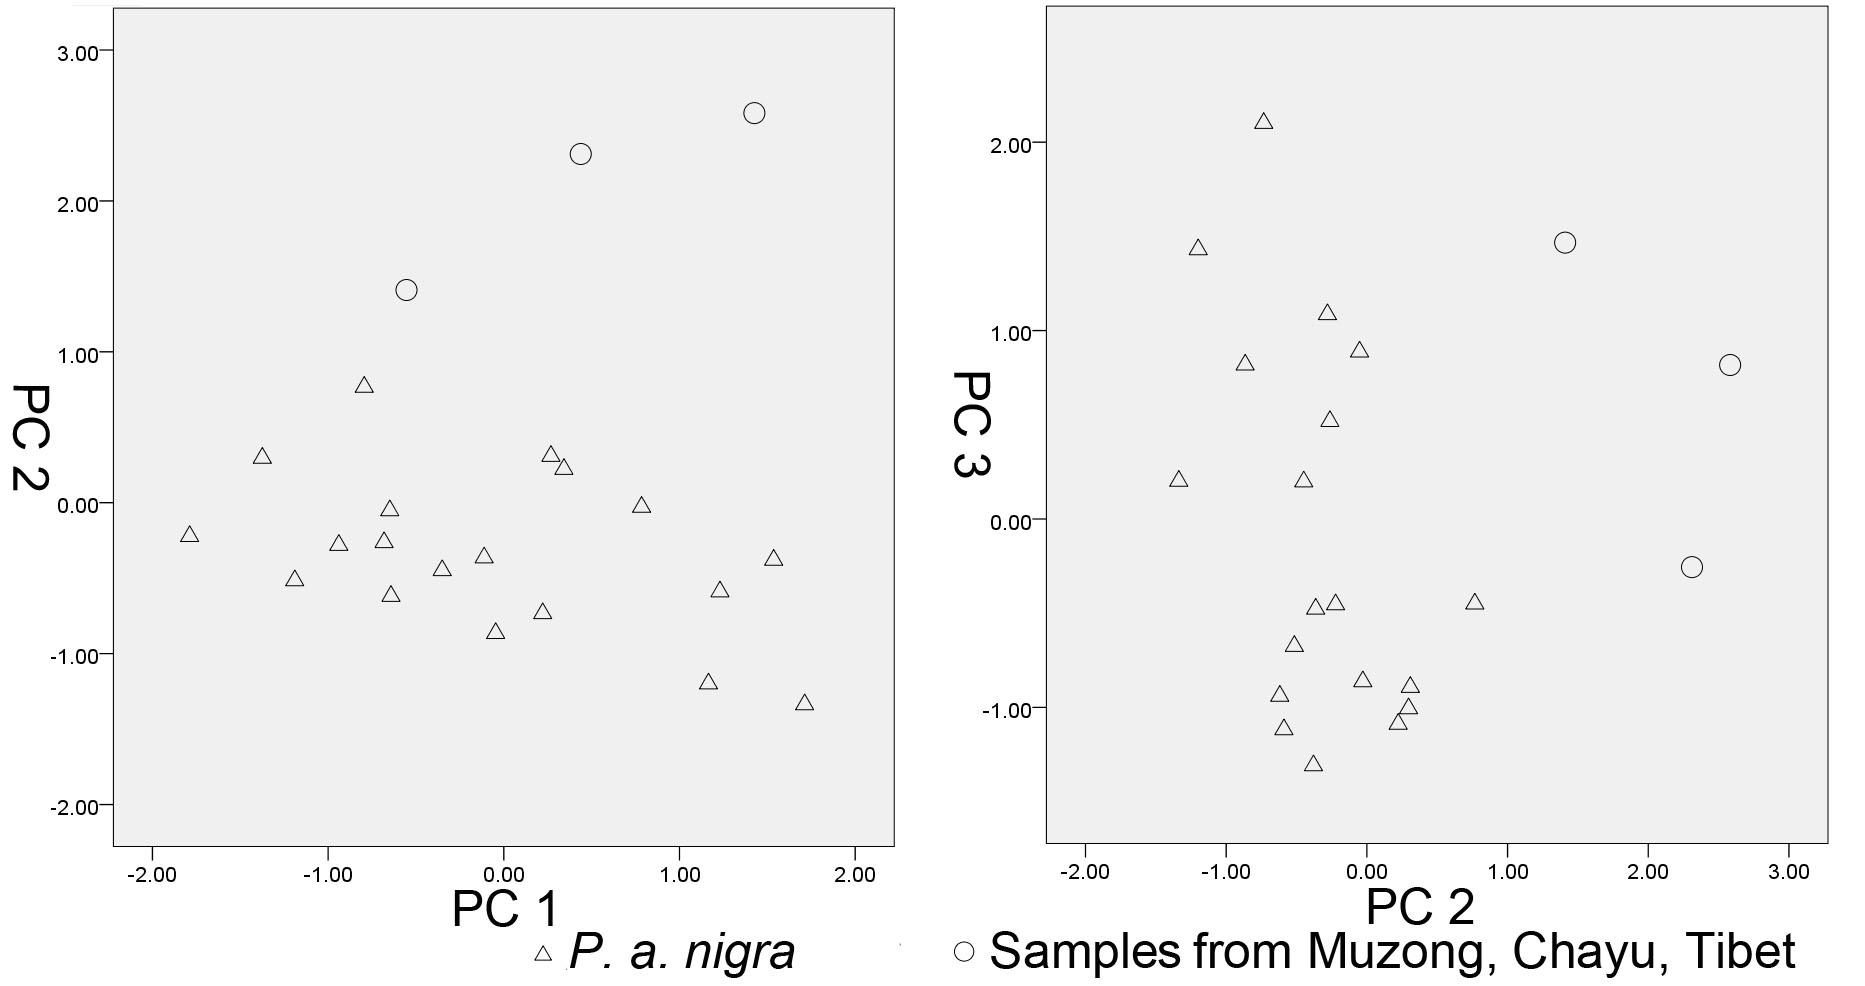
Fig 3
Scatterplots of the samples for principal component factors 1 vs. 2 and 2 vs. 3, respectively.