
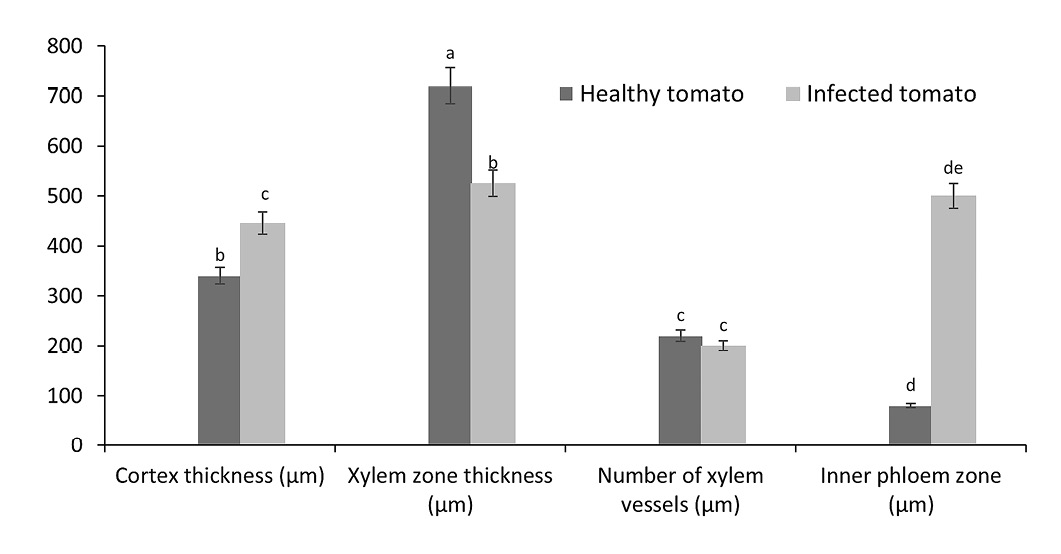
Figure 6:
Comparison of plant parameters between healthy and diseased samples. Alphabets indicate statistical difference among treatments (factorial ANOVA; LSD test at α = 0.05).
Comparison of plant parameters between healthy and diseased samples. Alphabets indicate statistical difference among treatments (factorial ANOVA; LSD test at α = 0.05).