
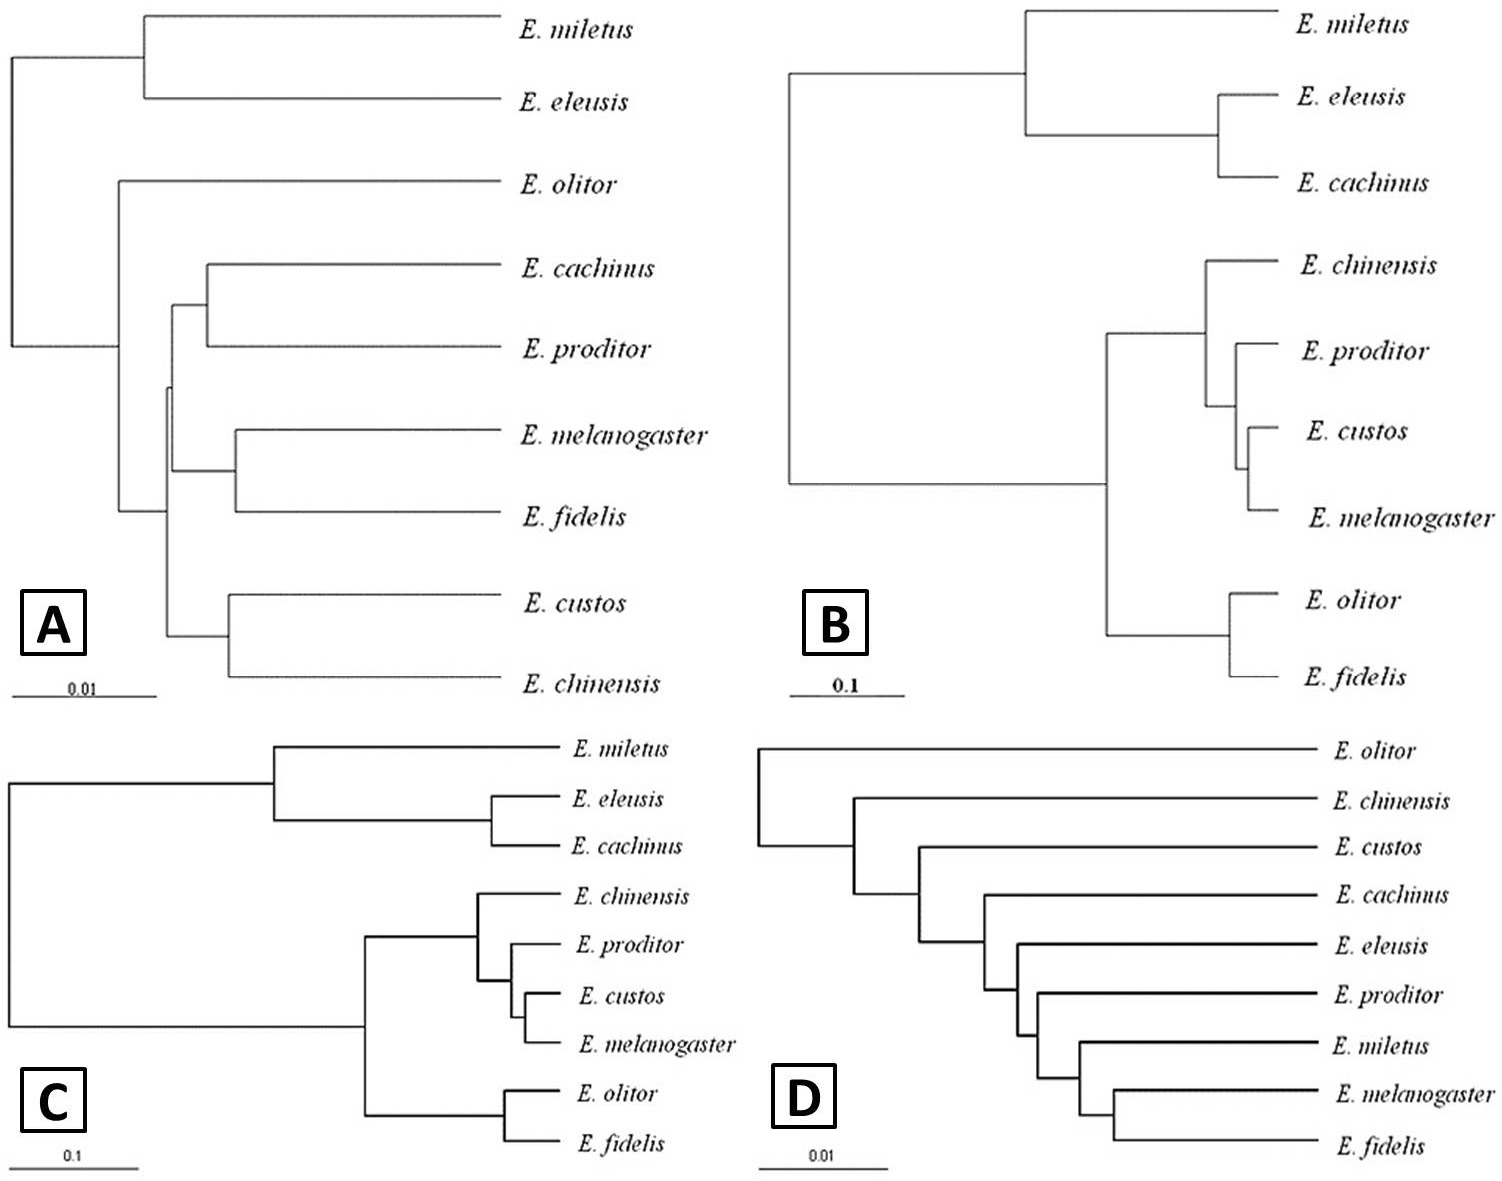
Fig. 3.
UPGMA trees showing morphometric affinity among populations calculated from pair-wise procrustes distances between consensus configurations of each species. A, similarities based on the dorsal view of the cranium; B, similarities based on the lateral view of the cranium; C, similarities based on the ventral view of the cranium, D, similarities based on the mandible. The below line was mean procrustes distances.